The Seven Wastes in Lean Manufacturing
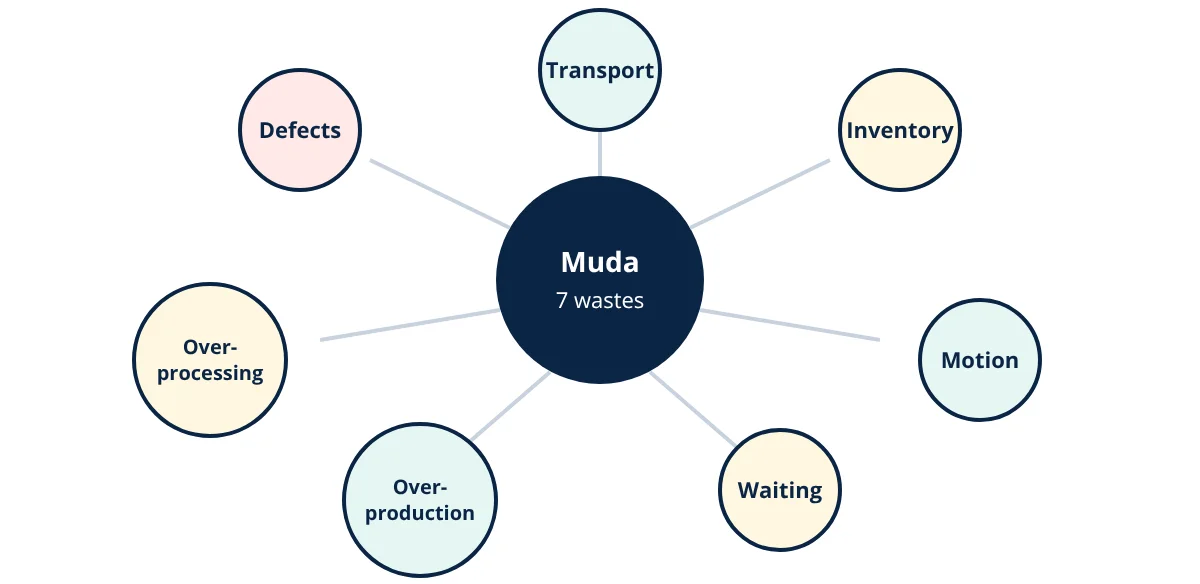
The seven wastes (Japanese: muda) in lean manufacturing are activities that consume time, effort or resources without adding value for the customer. Identified by Taiichi Ohno in the Toyota Production System, they are often remembered as TIMWOOD: Transport, Inventory, Motion, Waiting, Overproduction, Overprocessing and Defects. Many add an eighth, unused skills or talent. Lean tools such as value stream mapping, 5S, SMED, kanban, poka-yoke and standard work help find and remove these wastes.
Lean thinking starts from the customer’s view of value. Only steps that change the product in a way the customer is willing to pay for add value. Everything else is waste. Studies of typical processes often find that value adding time is a small fraction, sometimes under 5%, of the total lead time. Removing waste shortens lead time, frees space and capacity, improves quality and lowers cost.
Value added and non-value added activities
- Value added (VA): transforms the product as the customer wants, done right first time, for example machining a feature or assembling a part.
- Necessary non-value added (NNVA): does not add value but is currently required, such as some inspection or regulatory paperwork. Minimise it.
- Non-value added (NVA): pure waste. Eliminate it.
The seven wastes explained
1. Transport
Moving materials, parts or products between processes or locations without adding value. Examples: forklifts carrying parts between distant departments, multiple storage moves, shipping between plants. Each move costs time, handling effort and risk of damage. Remedies: cellular layouts, placing processes close together, point of use storage, conveyors only where justified.
2. Inventory
Raw materials, work in progress (WIP) and finished goods beyond what is needed now. Inventory ties up cash and space, hides problems such as machine breakdowns and quality issues, and risks obsolescence. Remedies: pull systems with kanban, smaller batches, one piece flow, quick changeovers (SMED), and economic ordering such as the EOQ model where demand is steady.
3. Motion
Unnecessary movement of people: walking to fetch tools, reaching, bending, searching for items. It wastes time and causes fatigue and injuries. Remedies: 5S workplace organisation, ergonomic workstation design, tools at point of use, and time and motion study.
4. Waiting
People or machines idle while waiting for materials, information, approvals, machine cycles, maintenance or the previous process. Remedies: line balancing, reliable equipment through preventive and predictive maintenance, synchronised flow, and multi-skilled operators.
5. Overproduction
Making more than the customer needs, or making it earlier. Ohno called this the worst waste because it generates the others: extra inventory, transport, storage and hidden defects. Remedies: produce to takt time, pull scheduling, level loading (heijunka).
6. Overprocessing
Doing more work than the customer requires: tighter tolerances than needed, extra polishing, redundant inspections, duplicate data entry, overly complex machines. Remedies: understand true customer requirements, simplify designs and processes, value engineering.
7. Defects
Scrap, rework, returns and warranty claims, plus the inspection and paperwork they cause. Remedies: mistake proofing (poka-yoke), standard work, root cause analysis, statistical process control and Six Sigma DMAIC projects.
The eighth waste: unused talent
Not using people’s knowledge, ideas and skills. Engaging operators in kaizen (continuous improvement) is one of the most powerful ways to find and remove the other wastes.
Takt time and lead time
Takt time sets the pace of production to customer demand:
Process cycle efficiency shows how much of the lead time adds value:
- Given
- A machining cell works one shift of 8 hours with 60 minutes of breaks; customer demand is 420 parts per day. A value stream map shows value added time of 6 minutes per part, but total lead time from raw material to dispatch is 4 days of 7 working hours.
- Find
- Takt time and process cycle efficiency.
- Assumptions
- Lead time measured in working time only.
- Solution
- Available time = 7 h × 3600 = 25 200 s
Takt = 25 200 ÷ 420 = 60 s per part
Lead time = 4 × 7 × 60 = 1680 min
PCE = 6 ÷ 1680 = 0.0036 = 0.36% - Answer
- Takt time is 60 s; only 0.36% of lead time adds value, so most of the time is waiting and inventory between steps
- Limitations
- Lead time often varies widely; measuring several products over time gives a better picture.
Lean tools for removing waste
| Tool | Main wastes addressed |
|---|---|
| Value stream mapping | All, by making flow and waits visible |
| 5S (sort, set in order, shine, standardise, sustain) | Motion, defects, waiting |
| Kanban and pull systems | Overproduction, inventory |
| SMED (quick changeover) | Inventory, waiting, overproduction |
| Poka-yoke (mistake proofing) | Defects |
| Standard work | Motion, defects, variation |
| Cellular layout and one piece flow | Transport, inventory, waiting |
| Total productive maintenance (TPM) | Waiting, defects |
The seven wastes outside the factory
The same seven wastes appear in offices and services. In an engineering department, transport is passing drawings between departments for approvals; inventory is a queue of unreviewed change requests; motion is searching for the latest file version; waiting is a design blocked for a test result; overproduction is reports nobody reads; overprocessing is detail beyond what the customer needs; and defects are drawing errors found on the shop floor. Hospitals, banks and software teams use the same lens to cut delays and errors.
Applying the seven wastes on the shop floor
Start small and visible: pick one product family, map its value stream from order to delivery, and mark every place where material or information waits, and measure how long it waits there.
A practical approach is a gemba walk: go to where the work is done, observe, ask why, and note each waste with the people doing the work. Then prioritise, run small experiments (PDCA cycles), standardise what works and repeat. Measures such as lead time, WIP, first pass yield, OEE and floor space show progress. Over time, focusing on the seven wastes builds a culture of continuous improvement that keeps finding smaller wastes to remove, supported by sound production planning and control.
Frequently asked questions
What does TIMWOOD stand for?
TIMWOOD is a memory aid for the seven wastes: Transport, Inventory, Motion, Waiting, Overproduction, Overprocessing and Defects. Adding Skills (unused talent) gives TIMWOODS, often called the eighth waste.
Which of the seven wastes is the worst?
Taiichi Ohno considered overproduction the worst, because making too much or too early creates and hides the other wastes: it causes excess inventory, extra transport and handling, storage, waiting for space, and delays the discovery of defects.
Are the seven wastes only for factories?
No. The same wastes appear in offices, hospitals, software development and services: waiting for approvals, unnecessary reports (overprocessing), searching for files (motion), backlogs (inventory), handoffs between departments (transport) and errors needing rework (defects).
References
- T. Ohno, Toyota Production System: Beyond Large-Scale Production, Productivity Press, 1988
- J. P. Womack and D. T. Jones, Lean Thinking: Banish Waste and Create Wealth in Your Corporation, Simon and Schuster, 1996
- M. Rother and J. Shook, Learning to See: Value Stream Mapping to Add Value and Eliminate Muda, Lean Enterprise Institute
- J. K. Liker, The Toyota Way, 2nd ed., McGraw-Hill, 2020
Get one engineering email a week
New articles, worked examples and study notes every week. Free, no spam, unsubscribe any time.