Six Sigma DMAIC Methodology Explained
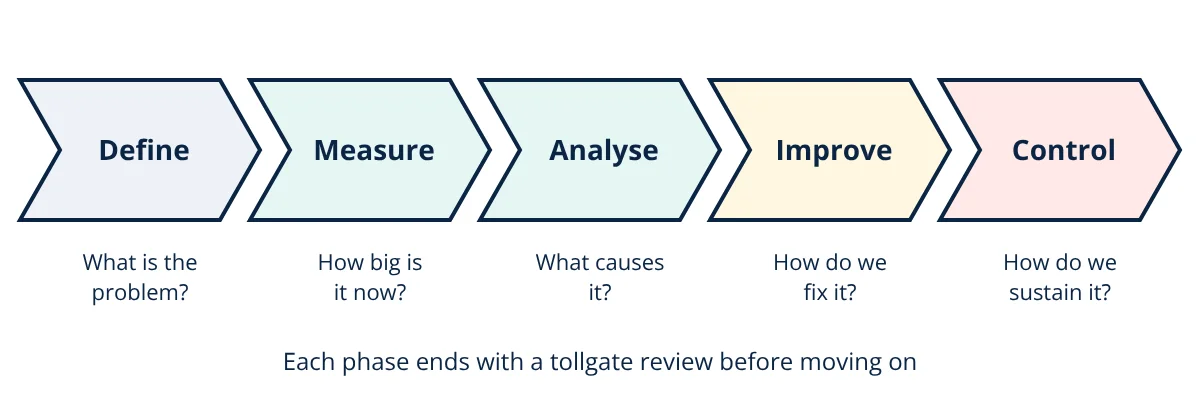
Six Sigma DMAIC is a structured, data driven method for improving existing processes by reducing variation and defects. Its five phases are: Define the problem, customer requirements and project scope; Measure current performance and validate the measurement system; Analyse data to find root causes; Improve the process by testing and implementing solutions; and Control the gains with monitoring and standardisation. A six sigma process produces about 3.4 defects per million opportunities (DPMO). Projects are led by trained Green Belts and Black Belts.
Six Sigma was developed at Motorola in the 1980s and made famous by General Electric in the 1990s. It treats quality problems as statistical problems: if the causes of variation in a process are understood and controlled, defects fall. DMAIC is its core problem solving roadmap, and ISO 13053 standardises it.
Sigma level and DPMO
Sigma (σ) is the standard deviation of a process. The sigma level expresses how many standard deviations fit between the process mean and the nearest specification limit, after allowing for long term drift. Performance is often measured as defects per million opportunities:
| Sigma level | DPMO (with 1.5σ shift) | Yield |
|---|---|---|
| 2 | 308 537 | 69.1% |
| 3 | 66 807 | 93.3% |
| 4 | 6 210 | 99.38% |
| 5 | 233 | 99.977% |
| 6 | 3.4 | 99.99966% |
The DMAIC phases
Define
- Write a clear problem statement and project charter: scope, goals, business case, team, timeline.
- Identify customers and their critical to quality (CTQ) requirements through the voice of the customer.
- Map the process at high level with a SIPOC (suppliers, inputs, process, outputs, customers).
Measure
- Define the output metric (Y) and how it will be measured.
- Validate the measurement system with gauge R&R (repeatability and reproducibility) studies; a poor measurement system can hide or invent problems.
- Collect baseline data and calculate current performance: yield, DPMO, sigma level and process capability indices Cp and Cpk.
Analyse
- Identify potential causes (Xs) with cause and effect (fishbone) diagrams, process maps and 5 Whys, as in root cause analysis methods.
- Test which causes really matter using data: Pareto charts, scatter plots, hypothesis tests, regression and ANOVA.
- Express the relationship as Y = f(X₁, X₂, …).
Improve
- Generate solutions that address verified root causes.
- Use design of experiments (DOE) to find optimal settings of key factors.
- Pilot solutions, check results statistically, assess risks with tools such as FMEA, and implement.
Control
- Standardise the new method with procedures, training and mistake proofing.
- Monitor key inputs and outputs with control charts.
- Write a control plan with reaction rules, hand over to the process owner and close the project with documented savings.
- Given
- An assembly line produced 5000 units last month. Each unit has 8 opportunities for a defect (critical features). Inspection found 120 defects. After a DMAIC project, the next month had 12 defects in 5000 units.
- Find
- DPMO and approximate sigma level before and after.
- Assumptions
- Sigma levels read from the standard table including the 1.5σ shift.
- Solution
- Before: DPMO = 120 ÷ (5000 × 8) × 10⁶ = 3000, between 4σ (6210) and 5σ (233), about 4.2σ
After: DPMO = 12 ÷ 40 000 × 10⁶ = 300, close to 5σ (about 4.9σ) - Answer
- DPMO fell from 3000 (about 4.2σ) to 300 (about 4.9σ), a 90% reduction in defects
- Limitations
- One month may not be representative; control charts should confirm the improvement is stable.
A worked DMAIC story
Consider a plant where 4% of moulded housings are rejected for short shots, parts not completely filled with plastic.
- Define: the team writes a charter to cut short shot rejects from 4% to below 1% within four months, worth a known annual saving in scrap and rework. The customer CTQ is a fully formed housing with no visible defects.
- Measure: they confirm that inspectors agree on what counts as a short shot through an attribute agreement study, then collect a month of data by machine, mould cavity, shift and material lot.
- Analyse: a Pareto chart shows most rejects come from two cavities of one mould. A fishbone session lists possible causes, and data show rejects rise when barrel temperature drops and when one material supplier is used. A hypothesis test confirms the supplier difference is significant.
- Improve: a designed experiment varies melt temperature, injection speed and hold pressure. The best settings plus cleaning a partly blocked vent in the two cavities bring rejects to 0.6% in a pilot run.
- Control: new settings go into the machine recipe with locked parameters, vent cleaning is added to the preventive maintenance plan, and a p chart of reject rate is posted at the machine with a reaction plan.
The result is documented, savings are confirmed by finance, and the process owner takes over monitoring.
Common pitfalls
- Choosing projects that are too large or vague to finish in a few months.
- Jumping to solutions in the Define phase before data confirm the causes.
- Skipping measurement system analysis and chasing noise.
- Declaring success without a control plan, so the process drifts back.
- Treating Six Sigma as a statistics exercise rather than a team effort with the people who run the process.
Roles in Six Sigma
- Champion or sponsor: senior manager who selects projects and removes barriers.
- Master Black Belt: expert coach and trainer.
- Black Belt: full time project leader skilled in advanced statistics.
- Green Belt: part time project leader or team member.
- Yellow Belt: team member with basic training.
- Process owner: responsible for sustaining results.
Common tools by phase
| Phase | Typical tools |
|---|---|
| Define | Project charter, SIPOC, voice of customer, CTQ tree |
| Measure | Process map, data collection plan, gauge R&R, capability analysis |
| Analyse | Fishbone, Pareto, 5 Whys, hypothesis tests, regression |
| Improve | Brainstorming, DOE, pilot runs, FMEA, poka-yoke |
| Control | Control charts, control plan, standard work, audits |
Making Six Sigma DMAIC work
Success depends on choosing projects linked to business goals and customer needs, leadership support, good data and disciplined tollgate reviews. Projects typically take three to six months. Combined with lean tools that remove the seven wastes, DMAIC gives organisations a powerful, repeatable way to improve quality and reduce cost.
Frequently asked questions
What does six sigma quality mean?
A six sigma process produces no more than about 3.4 defects per million opportunities. This figure assumes the process mean can drift by 1.5 standard deviations over the long term, so the nearest specification limit is 4.5 sigma from the shifted mean. Without that shift, six sigma would mean about 2 defects per billion.
What is the difference between DMAIC and DMADV?
DMAIC improves an existing process that is not meeting requirements. DMADV (Define, Measure, Analyse, Design, Verify), also called Design for Six Sigma, is used to create a new product or process, or to redesign one so completely that improving the old one is not worthwhile.
How does Six Sigma relate to Lean?
Lean focuses on removing waste and improving flow and speed; Six Sigma focuses on reducing variation and defects using data and statistics. Many organisations combine them as Lean Six Sigma, using lean tools for flow and DMAIC for complex quality problems.
References
- ISO 13053-1:2011, Quantitative methods in process improvement: Six Sigma, Part 1: DMAIC methodology
- F. W. Breyfogle III, Implementing Six Sigma, 2nd ed., Wiley
- T. Pyzdek and P. Keller, The Six Sigma Handbook, 5th ed., McGraw-Hill
- D. C. Montgomery, Introduction to Statistical Quality Control, 8th ed., Wiley
Get one engineering email a week
New articles, worked examples and study notes every week. Free, no spam, unsubscribe any time.