Fault Tree Analysis (FTA) Explained: Gates and Cut Sets
Fault tree analysis (FTA) is a top-down, deductive method that starts from one undesired system event and breaks it into the combinations of component failures, human errors and external events that can cause it. Events are linked by AND and OR logic gates, and the tree gives minimal cut sets and the top event probability.
Fault tree analysis is one of the most widely used tools in system safety and reliability engineering. It answers a precise question: what has to go wrong, and in what combination, for this specific accident or failure to happen? The method was developed in 1961 and 1962 at Bell Telephone Laboratories for the US Air Force Minuteman launch control system, then adopted by Boeing, the nuclear industry and NASA. Today it is standardised in IEC 61025 and used in process plants, aircraft, rail signalling, medical devices and functional safety studies.
What fault tree analysis does
FTA is deductive: it reasons from an effect back to its causes. The analyst picks one top event, such as “loss of cooling to the reactor” or “aircraft fails to lower landing gear”, and asks what immediate causes could produce it. Each cause is then broken down again until the analysis reaches basic events, which are failures that need no further development, such as a pump failing to start or a valve sticking closed.
The result is a logic diagram that shows:
- every combination of failures that leads to the top event (the cut sets),
- which failures are single points of failure,
- where redundancy really protects the system and where it does not,
- and, with failure data, the probability or frequency of the top event.
This makes FTA complementary to FMEA. FMEA works bottom-up from each failure mode and covers many effects, while FTA focuses on one top event and handles multiple failures acting together. Hazards for the top event usually come from a HAZOP study or a preliminary hazard analysis.
Fault tree symbols and gates
IEC 61025 and the NRC Fault Tree Handbook (NUREG-0492) use a common set of symbols.
Event symbols
- Rectangle (intermediate event): a fault that results from other events through a gate below it. The top event is drawn as a rectangle.
- Circle (basic event): a basic initiating failure with known or estimated probability data.
- Diamond (undeveloped event): an event not developed further, because of lack of information or because it is judged unimportant.
- House (external event): an event that is normally expected to occur or not occur, used as a switch to model different conditions.
- Triangle (transfer): shows that the tree continues on another page.
Logic gates
- OR gate: the output event occurs if at least one input event occurs.
- AND gate: the output event occurs only if all input events occur. AND gates model redundancy.
- Voting gate (k out of n): the output occurs if at least k of the n inputs occur, for example a 2 out of 3 trip system.
- Inhibit gate: the output occurs when the input occurs and a stated condition is satisfied.
- Priority AND gate: the output occurs only if the inputs occur in a specified order. It is one of the dynamic gates described in the NASA handbook.
How to perform fault tree analysis step by step
The NASA and NRC handbooks describe broadly the same procedure.
- Define the system and its boundaries: drawings, operating modes, interfaces, and what is inside and outside the analysis.
- Define the top event precisely: one undesired state, with the system condition and time, for example “no water at the sprinkler header within 30 s of demand”.
- Develop the tree: for each event, ask for the immediate, necessary and sufficient causes and connect them with the correct gate. Stop at basic events with available data.
- Find the minimal cut sets using Boolean algebra or software.
- Quantify: assign probabilities or failure rates to basic events and calculate the top event probability.
- Rank importance: identify which basic events contribute most.
- Act and document: propose design or maintenance changes and record assumptions.
A useful rule from NUREG-0492 is the “immediate cause” concept: move down the tree in small steps rather than jumping straight to component failures, so that no cause path is missed.
Minimal cut sets and Boolean algebra
A fault tree is a Boolean expression. An OR gate is a logical sum (A + B) and an AND gate is a logical product (A · B). Simplifying the expression with Boolean rules, such as A + A · B = A, gives the minimal cut sets.
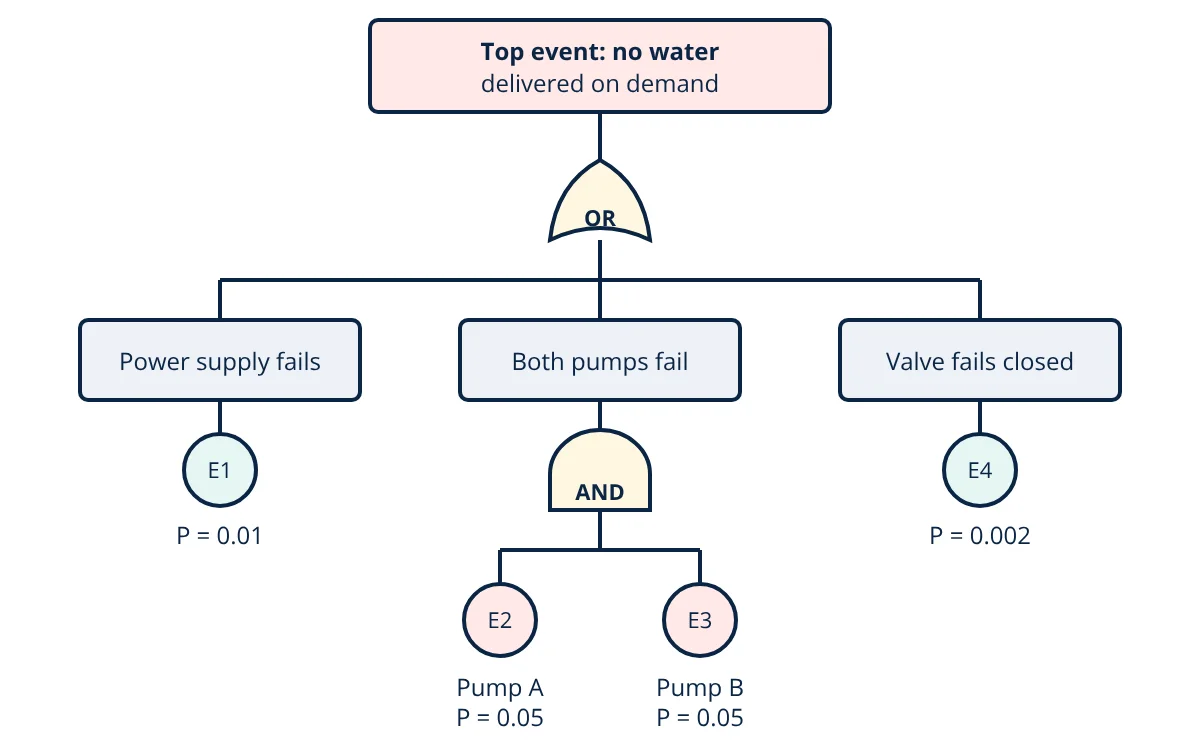
For the tree in the figure, the top event T is:
So the minimal cut sets are E1, E4 and the pair E2 and E3. E1 and E4 are first order cut sets, meaning single points of failure. The pump pair is a second order cut set, because both pumps must fail. In general, low order cut sets deserve the most attention.
A major caution is common cause failure. Two identical pumps in the same room, fed from the same supply and maintained by the same procedure, may fail together. The handbooks recommend modelling common cause failures explicitly, otherwise AND gates can make redundancy look far better than it is.
Quantitative fault tree analysis
If basic events are independent, gate probabilities follow from probability rules:
When all probabilities are small, the rare event approximation sums the cut set probabilities, which gives a slightly conservative (higher) result:
For a non repairable component with constant failure rate λ, the probability of failure by time t is:
The approximation holds when λt is small. Failure rate concepts are covered in MTBF, MTTR and availability.
- Given
- The fire water system in the figure. Probabilities of failure on demand: power supply E1 = 0.01, pump A E2 = 0.05, pump B E3 = 0.05, control valve E4 = 0.002.
- Find
- The top event probability, exact and by the rare event approximation, and the share contributed by the power supply.
- Assumptions
- All basic events are independent; no common cause failure between the pumps.
- Solution
- AND gate: P(E2 · E3) = 0.05 × 0.05 = 0.0025
OR gate exact: P_T = 1 − (1 − 0.01)(1 − 0.0025)(1 − 0.002) = 1 − 0.98555 = 0.01445
Rare event approximation: P_T ≈ 0.01 + 0.0025 + 0.002 = 0.0145
Power supply share: 0.01 ÷ 0.01445 = 0.69, about 69% - Answer
- The top event probability is about 0.0145 per demand, and the single power supply contributes about 69% of it. Adding a second, independent power source would give the largest risk reduction.
- Limitations
- Real pumps share causes such as power, suction and maintenance, so ignoring common cause failure underestimates the AND gate probability. Data uncertainty in basic events also carries through to the result.
Importance measures
Once quantified, the tree shows where improvement pays off. The Fussell-Vesely importance of a basic event is the fraction of the top event probability coming from cut sets that contain it, as calculated for the power supply above. Birnbaum importance is the change in top event probability per unit change in the basic event probability. Both are described in the NASA handbook and in Rausand’s System Reliability Theory.
Key formulas for fault tree analysis
| Quantity | Formula | Symbols and units |
|---|---|---|
| AND gate probability | P = P1 × P2 × … × Pn | Pi = probability of independent input events, dimensionless |
| OR gate probability | P = 1 − (1 − P1)(1 − P2)…(1 − Pn) | Exact for independent inputs |
| Rare event approximation | P_T ≈ sum of P(Cj) | Cj = minimal cut sets; valid when probabilities are small |
| Component failure probability | q(t) = 1 − e^(−λt) ≈ λt | λ = failure rate per hour, t = time in hours |
| Fussell-Vesely importance | FV_i = P(cut sets containing i) ÷ P_T | Fraction of top event probability, dimensionless |
Advantages and limitations
Advantages
- Gives a clear visual picture of how failures combine.
- Finds single points of failure and weak redundancy.
- Supports both qualitative and quantitative analysis.
- Fits naturally with layer of protection analysis and safety integrity level verification.
Limitations
- Covers one top event per tree, so many trees may be needed.
- Large trees need software, and results depend on the analyst’s skill and data quality.
- Standard static gates do not capture timing or sequence well; dynamic gates or Markov models are needed for that.
- Human error and common cause failures are hard to quantify.
FTA is also used after incidents, alongside root cause analysis methods, to show which combination of failures actually occurred.
Fault tree analysis interview and viva questions
- Why is fault tree analysis called a deductive method? It starts from a defined undesired top event and reasons downward to the causes that could produce it, rather than starting from component failures.
- What is the difference between an AND gate and an OR gate in a fault tree? An OR gate output occurs if any one input occurs, while an AND gate output occurs only if all inputs occur together, which is how redundancy is modelled.
- What does a first order minimal cut set indicate? It is a single basic event that alone causes the top event, so it is a single point of failure and usually a priority for design improvement.
- When is the rare event approximation acceptable? When basic event probabilities are small, so summing cut set probabilities gives a result close to the exact value and slightly on the conservative side.
- Why must common cause failures be considered in an AND gate? Redundant items that share causes may fail together, so multiplying their probabilities as independent events can greatly underestimate the real risk.
Related reading
Frequently asked questions
What is the difference between fault tree analysis and FMEA?
FMEA is a bottom-up method that starts from each component failure mode and asks what effect it has. Fault tree analysis is a top-down method that starts from one undesired system event and works down to the combinations of failures that cause it. FTA handles multiple simultaneous failures better, while FMEA gives wider coverage of single failures.
What is a minimal cut set in a fault tree?
A cut set is any group of basic events that, if all occur, causes the top event. A minimal cut set is one that cannot be reduced: removing any event from it means the top event no longer occurs. Single event minimal cut sets show single points of failure.
Can fault tree analysis be qualitative only?
Yes. A qualitative fault tree identifies minimal cut sets and single points of failure without any probability data. Quantitative analysis adds failure probabilities or rates for the basic events to estimate the probability or frequency of the top event and to rank events by importance.
References
- IEC 61025:2006, Fault tree analysis (FTA)
- W. E. Vesely, F. F. Goldberg, N. H. Roberts and D. F. Haasl, Fault Tree Handbook, NUREG-0492, US Nuclear Regulatory Commission, 1981
- M. Stamatelatos et al., Fault Tree Handbook with Aerospace Applications, Version 1.1, NASA Office of Safety and Mission Assurance, 2002
- C. A. Ericson II, Hazard Analysis Techniques for System Safety, 2nd ed., Wiley, 2015
- M. Rausand, A. Barros and A. Hoyland, System Reliability Theory: Models, Statistical Methods, and Applications, 3rd ed., Wiley, 2020
Get one engineering email a week
New articles, worked examples and study notes every week. Free, no spam, unsubscribe any time.