Risk Matrix: Likelihood, Severity and Risk Ranking
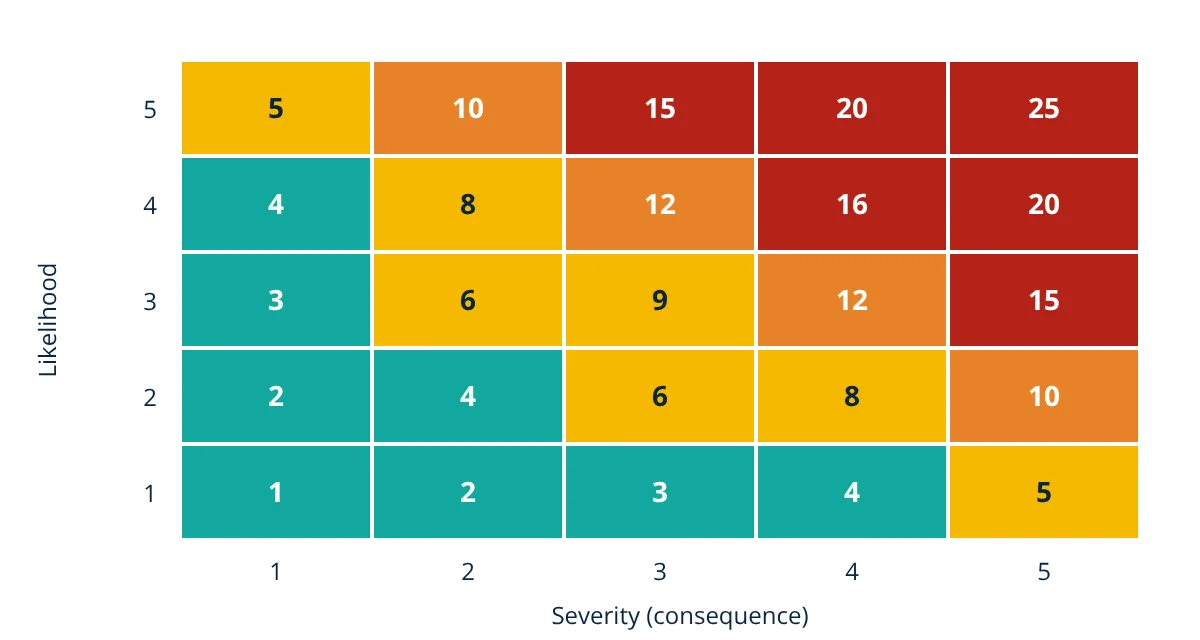
A risk matrix is a grid that ranks risks by combining likelihood (how often an event could occur) and severity or consequence (how bad the outcome would be). Each axis has defined levels, commonly five each in a 5 × 5 matrix. Multiplying or combining the two gives a risk score that falls into colour coded bands such as low, medium, high and extreme. The band decides the response: accept, reduce risk to ALARP, or stop the activity until controls are added. Risk matrices are simple and widely used in workplace risk assessment, HAZOP, FMEA and project risk registers.
Every organisation faces more risks than it can address at once. A risk matrix gives a quick, consistent way to compare risks, decide which need urgent action, and communicate them to managers and workers. It is a semi-quantitative tool: more structured than gut feeling, less precise than full quantitative risk assessment. Standards such as ISO 31000 and IEC 31010 describe it as one of many risk assessment techniques.
Risk = likelihood × consequence
Risk combines how likely an event is and how severe its consequences would be:
In a matrix, L and C are usually scored on ordinal scales, such as 1 to 5, rather than true probabilities and losses.
Building a risk matrix
Likelihood scale
| Level | Descriptor | Example definition |
|---|---|---|
| 1 | Rare | May occur only in exceptional circumstances; less than once in 100 years |
| 2 | Unlikely | Could occur in the industry; once in 10 to 100 years |
| 3 | Possible | Could occur at this site; once in 1 to 10 years |
| 4 | Likely | Will probably occur; about once a year |
| 5 | Almost certain | Expected to occur several times a year |
Severity scale
Severity is defined for each type of consequence: people, environment, asset damage and production loss, reputation and legal.
| Level | Descriptor | People | Asset / production |
|---|---|---|---|
| 1 | Insignificant | First aid | Negligible |
| 2 | Minor | Medical treatment | Small loss |
| 3 | Moderate | Lost time injury | Moderate loss, short shutdown |
| 4 | Major | Permanent disability or single fatality | Major damage, long shutdown |
| 5 | Catastrophic | Multiple fatalities | Loss of facility |
The highest severity across all consequence types is normally used.
Risk bands and responses
| Score | Band | Typical response |
|---|---|---|
| 1 to 4 | Low | Acceptable; manage with routine procedures |
| 5 to 9 | Medium | Tolerable if ALARP; consider further controls, monitor |
| 10 to 14 | High | Reduce risk; senior management attention; controls needed before or soon after starting |
| 15 to 25 | Extreme | Unacceptable; stop or do not start until risk is reduced |
Many matrices are asymmetric, weighting severity more heavily, so a rare catastrophic event is never treated the same as a frequent trivial one.
ALARP and tolerability
The UK HSE’s tolerability framework divides risk into three regions: unacceptable (must be reduced regardless of cost), tolerable if ALARP (reduce until further reduction is grossly disproportionate) and broadly acceptable (no further action normally needed). Risk matrix bands are often mapped to these regions.
How to use a risk matrix
- Identify the hazard and the credible worst outcome, for example through a HAZOP study or job safety analysis.
- Score severity using the defined scale.
- Score likelihood of that outcome, considering existing controls if assessing residual risk.
- Read the risk level from the matrix.
- Decide on actions according to the band, using the hierarchy of controls.
- Re-score with the new controls to confirm residual risk is acceptable.
- Record and review in a risk register.
- Given
- Three hazards in a workshop: (A) a forklift striking a pedestrian in a shared aisle, judged likelihood 3 and severity 4; (B) a minor cut from handling sheet metal, likelihood 4 and severity 2; (C) a dust explosion in an extraction system, likelihood 1 and severity 5.
- Find
- Risk scores, bands and priority order, and the effect of segregating forklift and pedestrian routes, which reduces likelihood of A to 1.
- Assumptions
- Score = L × C; bands as in the table above.
- Solution
- A: 3 × 4 = 12, high
B: 4 × 2 = 8, medium
C: 1 × 5 = 5, medium (but catastrophic severity)
A after segregation: 1 × 4 = 4, low - Answer
- Priority: A (12, high), then B (8) and C (5); segregation lowers A to 4, but C still deserves attention because its severity is catastrophic
- Limitations
- Multiplying ordinal scores can understate high severity, low likelihood risks, so many companies require specific review of any severity 5 hazard.
Calibrating the risk matrix
A matrix only works if its scales match the organisation’s risk tolerance. Calibration links each likelihood level to a frequency range, each severity level to concrete outcomes in several categories, and each colour band to required actions and approval levels. Teams then test the matrix against known incidents and scenarios to make sure results feel sensible, and adjust boundaries if, for example, all fatality scenarios end up green. Documenting these definitions in the management system keeps different sites and teams consistent.
Pitfalls of the risk matrix
Research such as Cox (2008) highlights weaknesses:
- Subjectivity: different people score the same hazard differently.
- Range compression: very different risks can fall into the same cell.
- Ordinal arithmetic: multiplying category numbers implies precision that does not exist.
- Ignoring rare catastrophes: low likelihood, high severity events can appear medium.
- Gaming: pressure to score risks low to avoid action.
Good practice reduces these problems: clear definitions with numerical frequency ranges, calibrated examples, team scoring, special rules for high severity events, and using quantitative methods such as LOPA or safety integrity level assessment for critical hazards.
Risk matrix in other tools
The matrix itself should be reviewed whenever the business, its activities or its risk appetite change.
Risk matrices appear inside many methods: HAZOP worksheets, FMEA (which uses a similar RPN concept), mine hazard assessments, construction risk assessments and project risk registers. Whatever the context, the value comes from the discussion and the actions that follow, not the number itself.
Frequently asked questions
What is a 5x5 risk matrix?
A 5x5 risk matrix has five likelihood levels, for example rare, unlikely, possible, likely and almost certain, and five severity levels, for example insignificant, minor, moderate, major and catastrophic. Each of the 25 cells is assigned a risk level, often colour coded from low (green) to extreme (red).
What does ALARP mean?
ALARP stands for As Low As Reasonably Practicable. It means that risk must be reduced until the cost, time and effort of further reduction would be grossly disproportionate to the benefit gained. In many risk matrices, the middle band is the ALARP region where further measures must be considered and justified.
Should risk be scored before or after controls?
Both. The inherent (or initial) risk is assessed assuming no or only basic controls, to show how serious the hazard is. The residual risk is assessed with the proposed or existing controls in place, to check that it is acceptable. The difference shows how much the controls are relied on.
References
- ISO 31000:2018, Risk management: Guidelines
- IEC 31010:2019, Risk management: Risk assessment techniques
- UK HSE, Reducing Risks, Protecting People (R2P2), 2001
- L. A. Cox Jr., What's Wrong with Risk Matrices?, Risk Analysis, 28(2), 2008
- ISO 45001:2018, Occupational health and safety management systems
Get one engineering email a week
New articles, worked examples and study notes every week. Free, no spam, unsubscribe any time.