Layer of Protection Analysis (LOPA) Explained
LOPA (layer of protection analysis) is a semi-quantitative risk assessment method that takes one hazard scenario, estimates how often its initiating event occurs, multiplies that frequency by the probability of failure on demand of each independent protection layer, and compares the mitigated frequency with a tolerable target to decide whether more protection, such as a SIF, is needed.
LOPA, or layer of protection analysis, sits between a qualitative hazard study and a full quantitative risk assessment. A HAZOP study finds the scenarios; LOPA puts order of magnitude numbers on them and asks a simple question: are the existing safeguards enough? It was formalised by the Center for Chemical Process Safety (CCPS) in 2001 and is the most common way to set the required safety integrity level of a safety instrumented function under IEC 61511.
What LOPA does
A LOPA study looks at one cause and consequence pair at a time. Each pair is a scenario, for example “level control valve fails open, tank overfills, flammable liquid is released”. For each scenario the team records:
- Initiating event (IE): the failure or error that starts the sequence, with a frequency per year.
- Enabling conditions and conditional modifiers: probabilities such as the fraction of time the unit is in the hazardous mode, or the chance of ignition or of people being present. CCPS 2015 gives guidance on when these may be used.
- Independent protection layers (IPLs): safeguards that can stop the scenario on their own, each with a probability of failure on demand (PFD).
- Consequence and tolerable frequency: the severity of the outcome and the maximum frequency the company will accept for it.
The output is the mitigated event frequency. If it is above the tolerable frequency, the gap must be closed, often by adding or upgrading a safety instrumented function (SIF).
The LOPA equation
The mitigated frequency of a consequence for one scenario is the initiating event frequency multiplied by every probability that must line up for the consequence to happen:
where f_IE is the initiating event frequency in events per year, P_j are enabling conditions and conditional modifiers, and PFD_i is the probability that IPL i fails when demanded. Each IPL gives a risk reduction factor:
When a SIF is needed, its required PFD comes from the ratio of the tolerable frequency to the frequency with all other layers in place:
Because LOPA values are rounded to powers of ten, the method is often done by adding exponents. That simplicity is its strength, but it also means results are only as good as the order of magnitude data behind them.
Layers of protection in LOPA
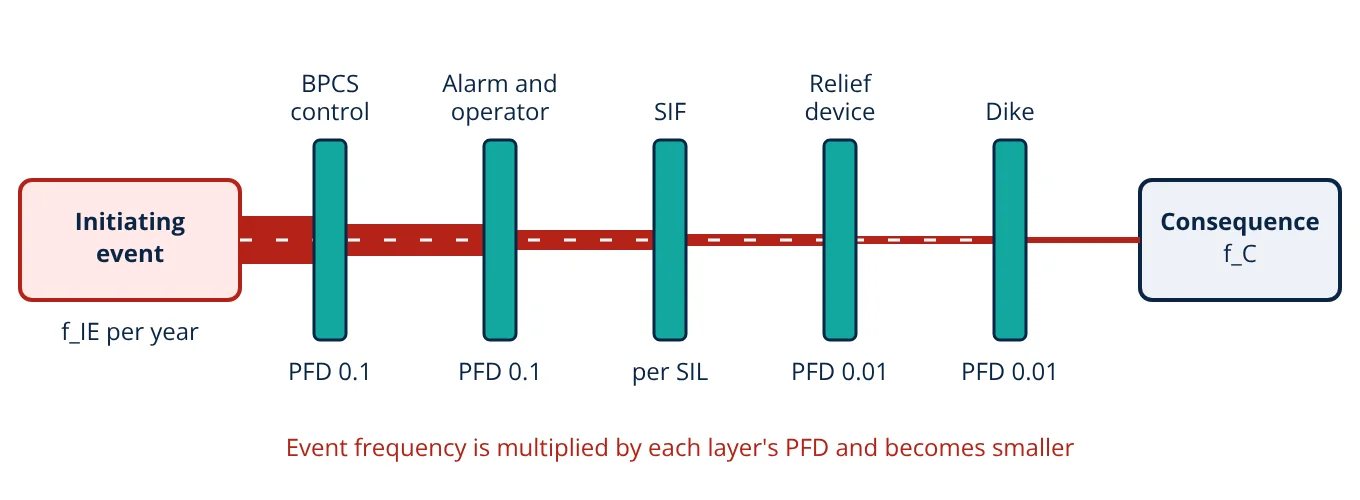
The figure shows typical layers in the order they act. The PFD values marked are the generic values given in CCPS 2001; a SIF takes a value from its SIL band. In a real scenario only the layers that actually prevent that consequence are credited. A dike, for example, mitigates the spread of a spill but does not prevent an overpressure.
What makes a layer independent
Not every safeguard is an IPL. CCPS sets out core attributes that a safeguard must meet before it can be credited:
- Effective: it can detect the condition and act in time to prevent the consequence, with enough capacity.
- Independent: it does not share components with the initiating event or with other IPLs claimed in the same scenario.
- Auditable: its performance can be checked by testing, inspection and records.
Items such as training, procedures, maintenance programmes and fire protection that only acts after a release are usually treated as safeguards that support IPLs, not as IPLs themselves.
Typical values used in LOPA
The values below are the generic order of magnitude figures published in CCPS 2001 and IEC 61511-3. Companies normally adopt an approved table and justify any lower PFD claim.
| Item | Typical value | Source and note |
|---|---|---|
| BPCS instrument loop failure (initiating event) | 0.1 per year | CCPS 2001 |
| BPCS control function as an IPL | PFD 0.1 | IEC 61511-1 limits BPCS credit to RRF of 10 or less |
| Operator response to alarm | PFD 0.1 | CCPS 2001, IEC 61511-3, with enough time to act |
| Pressure relief valve | PFD 0.01 | CCPS 2001, sized for the scenario |
| Dike or bund | PFD 0.01 | CCPS 2001, for loss of containment spread |
| SIF, SIL 1 | PFD 0.01 to 0.1 | IEC 61511-1 (RRF 10 to 100) |
| SIF, SIL 2 | PFD 0.001 to 0.01 | IEC 61511-1 (RRF 100 to 1000) |
| SIF, SIL 3 | PFD 0.0001 to 0.001 | IEC 61511-1 (RRF 1000 to 10 000) |
Tolerable risk criteria
LOPA needs a target. Each company sets its own tolerable frequency for each consequence category, often linked to the severity rows of its risk matrix. For individual risk, the UK HSE R2P2 framework treats a fatality risk of 1 in 1000 per year as the boundary of intolerable risk for workers and 1 in a million per year as broadly acceptable, with ALARP in between. Scenario targets for severe consequences are therefore set well below the worker limit, because one person is exposed to many scenarios.
- Given
- Overpressure of a batch reactor caused by failure of the BPCS pressure control loop, f_IE = 0.1 per year. The reactor runs this batch 50% of the year (enabling condition 0.5). Credited IPLs: an independent high pressure alarm with operator response, PFD 0.1, and a correctly sized relief valve, PFD 0.01. The company tolerable frequency for this consequence category is 1 × 10⁻⁶ per year.
- Find
- The mitigated frequency without a SIF, whether it meets the target, and the required PFD and SIL of a new SIF.
- Assumptions
- The alarm uses a separate transmitter from the failed control loop; the operator has enough time to act; no other conditional modifiers are claimed.
- Solution
- f_C = 0.1 × 0.5 × 0.1 × 0.01 = 5 × 10⁻⁵ per year
Target 1 × 10⁻⁶ per year, so the gap is 5 × 10⁻⁵ ÷ 1 × 10⁻⁶ = 50
PFD_SIF ≤ 1 × 10⁻⁶ ÷ 5 × 10⁻⁵ = 0.02, so RRF ≥ 50
Check: 5 × 10⁻⁵ × 0.02 = 1 × 10⁻⁶ per year - Answer
- Without a SIF the mitigated frequency is 5 × 10⁻⁵ per year, 50 times above target. A SIF with PFD of 0.02 or lower (RRF of 50 or more) is required, which falls in the SIL 1 band.
- Limitations
- Order of magnitude data only; common cause between the alarm and the SIF sensors must be excluded; the SIF design must then be verified for PFDavg, architecture and proof testing.
Many companies would specify the SIF to a PFD target with some margin below 0.02, or review whether another IPL could be added, before accepting the design.
Key formulas for LOPA
| Quantity | Formula | Symbols and units |
|---|---|---|
| Mitigated event frequency | f_C = f_IE × Π P_j × Π PFD_i | f_C and f_IE in events per year; P_j enabling conditions and modifiers; PFD_i of each IPL (dimensionless) |
| Risk reduction factor | RRF = 1 ÷ PFD | dimensionless |
| Required SIF PFD | PFD_SIF ≤ f_tolerable ÷ f_C, no SIF | f in events per year |
| Required SIF RRF | RRF_SIF ≥ f_C, no SIF ÷ f_tolerable | dimensionless; compare with SIL bands |
Strengths and limitations of LOPA
Strengths: quicker than full quantitative analysis, more consistent than a risk matrix alone, gives a clear documented basis for each SIL, and highlights safeguards that do not qualify as independent.
Limitations: it depends on the scenario list from the hazard study, uses generic data that may not suit a specific plant, and can hide common cause failures if independence is not checked carefully. It is not suited to complex scenarios with many interacting failures, where fault tree analysis or FMEA gives more insight. Results also depend on IPLs being maintained and tested as assumed, which links LOPA to reliability and availability management during operation.
LOPA interview and viva questions
- What is the main output of a LOPA study? The mitigated event frequency of each scenario and, where it exceeds the tolerable frequency, the risk reduction a new or upgraded safeguard such as a SIF must provide.
- What are the core attributes of an IPL? It must be effective in preventing the consequence, independent of the initiating event and other credited IPLs, and auditable.
- Why is BPCS credit limited to a PFD of 0.1? IEC 61511-1 limits a BPCS protection layer to a risk reduction of no more than 10 unless it is designed and managed to SIS standards.
- How is the required SIL found from LOPA? Divide the tolerable frequency by the mitigated frequency without the SIF to get the required PFD, then match it to the IEC 61511 SIL bands.
- Why can an alarm on the same transmitter as the failed control loop not be credited? It shares the failed component with the initiating event, so it is not independent and would fail at the same time.
Frequently asked questions
Is LOPA a qualitative or quantitative method?
LOPA is a semi-quantitative method. It uses order of magnitude numbers for initiating event frequencies and protection layer PFDs, usually rounded to powers of ten, so it is more rigorous than a risk matrix but much simpler than a full quantitative risk assessment with fault trees and consequence modelling.
Can the BPCS be both the initiating event and a protection layer?
Not for the same scenario in the simple case. If a failure of a BPCS loop causes the initiating event, another function in that same loop cannot be credited as an IPL. IEC 61511 allows a separate BPCS function to be credited only if it is independent of the initiating cause, and limits the credit to a risk reduction of no more than 10.
Who carries out a LOPA study?
A small multidisciplinary team, typically a facilitator experienced in LOPA, a process engineer, an operations representative and a control or instrument engineer. The team often works from scenarios already identified in a HAZOP study and uses the company's own tolerable risk criteria and approved tables of initiating event frequencies and IPL PFDs.
References
- CCPS, Layer of Protection Analysis: Simplified Process Risk Assessment, AIChE, 2001
- CCPS, Guidelines for Initiating Events and Independent Protection Layers in Layer of Protection Analysis, AIChE/Wiley, 2015
- IEC 61511-1:2016, Functional safety: Safety instrumented systems for the process industry sector, Part 1: Framework, definitions, system, hardware and application programming requirements
- IEC 61511-3:2016, Functional safety: Safety instrumented systems for the process industry sector, Part 3: Guidance for the determination of the required safety integrity levels
- IEC 61508-1:2010, Functional safety of electrical/electronic/programmable electronic safety-related systems, Part 1: General requirements
- HSE, Reducing Risks, Protecting People: HSE's decision-making process (R2P2), HSE Books, 2001
Get one engineering email a week
New articles, worked examples and study notes every week. Free, no spam, unsubscribe any time.