MTBF, MTTR and Availability Explained
MTBF (mean time between failures) is the average operating time between failures of a repairable item: total operating time divided by the number of failures. MTTR (mean time to repair) is the average time to restore it after a failure: total repair downtime divided by the number of repairs. Availability is the fraction of time the item is able to work, A = MTBF ÷ (MTBF + MTTR). With a constant failure rate λ = 1/MTBF, the probability of running a time t without failure is R(t) = e^(−t/MTBF). Together, MTBF and MTTR describe reliability and maintainability.
Reliability engineering asks how often equipment fails, how long it takes to fix, and how much of the time it is available. These questions affect safety, production output, maintenance planning and spare parts. MTBF, MTTR and availability are the most widely used metrics to answer them.
Definitions and formulas
MTBF for a repairable item over an observation period:
MTTR (often called mean time to restore):
MTTR may include diagnosis, waiting for parts and staff, repair, testing and restart; definitions should be stated clearly.
Failure rate for a constant rate:
often expressed in failures per hour, per million hours, or FIT (failures per 10⁹ hours) for electronics.
Inherent availability:
Operational availability also includes logistics delays, preventive maintenance downtime and administrative delays, so it is lower.
Reliability over time
For items with a constant failure rate (random failures), the probability of surviving a mission of length t without failure follows the exponential distribution:
At t = MTBF, R = e⁻¹ ≈ 0.37: only 37% of units are still working. This is why MTBF must not be confused with expected life.
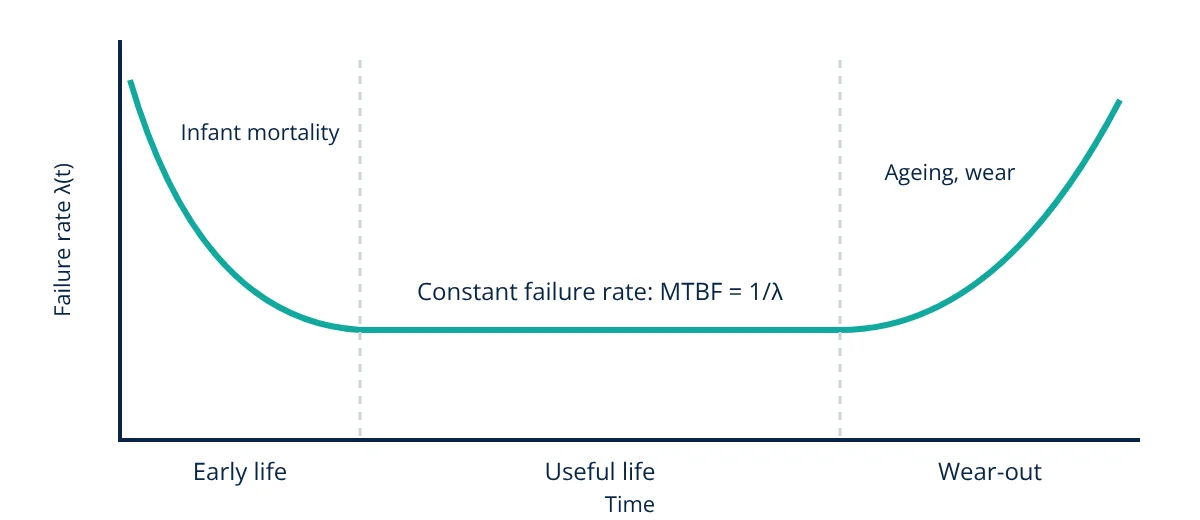
The bathtub curve
- Early life: failures from manufacturing defects and installation errors, reduced by burn-in, quality control and careful commissioning.
- Useful life: random failures at a roughly constant rate, where MTBF is meaningful.
- Wear-out: failures rise from fatigue, corrosion and wear; preventive replacement before this stage is often economic.
The Weibull distribution models all three regions with a shape parameter β (β below 1 for early failures, β = 1 for constant rate, β above 1 for wear-out) and is widely used to analyse real failure data.
System reliability
Series systems
If any one of n components failing causes system failure, failure rates add and reliabilities multiply:
Parallel (redundant) systems
If the system works as long as at least one of two identical items works:
System availability for two independent units in parallel is similarly A_s = 1 − (1 − A)². Redundancy is widely used in pumps, power supplies, controllers and safety systems, as discussed in safety integrity level.
- Given
- Over one year, a cooling water pump operated 8400 hours and failed 4 times. Total repair downtime was 36 hours.
- Find
- MTBF, MTTR, failure rate, availability, the probability of running a 720 hour month without failure, and the availability of two such pumps in parallel (one duty, one standby).
- Assumptions
- Constant failure rate; independent failures; standby pump available when needed.
- Solution
- MTBF = 8400 ÷ 4 = 2100 h
MTTR = 36 ÷ 4 = 9 h
λ = 1 ÷ 2100 = 4.76 × 10⁻⁴ per hour
A = 2100 ÷ (2100 + 9) = 0.9957 (99.57%)
R(720) = e^(−720 ÷ 2100) = e^(−0.343) = 0.71
Parallel: A_s = 1 − (1 − 0.9957)² = 1 − 0.0000185 = 0.99998 - Answer
- MTBF 2100 h, MTTR 9 h, availability 99.57%, 71% chance of a failure-free month; with a standby pump, system availability rises to about 99.998%
- Limitations
- Four failures give a rough estimate with wide confidence limits; common cause failures reduce the benefit of redundancy.
How to collect MTBF and MTTR data
Good metrics need good data. Every failure should be recorded in the maintenance management system with the asset, date and time of failure, time of restoration, failure mode, cause and work done. Operating hours come from run hour meters, control system logs or production records. Teams must agree on what counts as a failure (for example, any unplanned loss of function, not minor adjustments) and whether MTTR includes waiting for parts and staff. Grouping similar assets, such as all pumps of one type, gives more failures and therefore more reliable estimates than a single machine.
MTBF, MTTR and maintainability
MTTR is a measure of maintainability: how quickly and easily equipment can be restored. It is influenced in design by accessibility, modularity, standard parts, built in diagnostics and clear labelling, and in operation by spare parts stocking, tools, skills and procedures. Reducing MTTR is often the fastest way to raise availability, because it does not require changing how often equipment fails.
Using MTBF and MTTR in practice
- Benchmarking and trend tracking: rising MTBF shows maintenance and reliability improvements; rising MTTR may reveal spare parts or skills problems.
- Maintenance strategy: choosing between run to failure, preventive and predictive types of maintenance.
- Spare parts planning: expected failures per year = operating hours ÷ MTBF.
- Design and procurement: comparing suppliers’ reliability data, while checking how it was derived.
- Safety analysis: failure rates feed FMEA, fault trees and PFD calculations.
Mean time between failures for software and systems
The same ideas apply to control systems, networks and IT services, where uptime targets such as 99.9% (about 8.8 hours of downtime per year) or 99.99% (about 53 minutes) are common. For such systems, MTTR often depends more on detection and diagnosis time than on repair work itself.
Common mistakes
The following errors appear often in reliability reports and lead to wrong decisions about maintenance and spares.
- Treating MTBF as product life.
- Mixing calendar time and operating time.
- Counting different failure definitions inconsistently.
- Using manufacturer MTBF predictions (often based on handbook models such as MIL-HDBK-217 or field data from benign conditions) without considering the actual operating environment.
- Ignoring wear-out, where the constant failure rate assumption no longer holds.
Used carefully, MTBF, MTTR and availability turn maintenance records into insight, helping engineers decide where reliability improvements will pay off most, often guided by root cause analysis of repeat failures.
Frequently asked questions
Does an MTBF of 100 000 hours mean the device will last 100 000 hours?
No. MTBF describes average failure frequency during the useful life of a large population, not the lifespan of one unit. With a constant failure rate, only about 37% of units survive to reach the MTBF. A device with MTBF 100 000 hours may still wear out in 10 years.
What is the difference between MTBF and MTTF?
MTBF (mean time between failures) applies to repairable items that are restored and returned to service. MTTF (mean time to failure) applies to non-repairable items, such as a light bulb or a sealed bearing, that are replaced after their first failure. For constant failure rates, both equal the reciprocal of the failure rate.
How can availability be improved?
By increasing MTBF through better design, materials, condition monitoring and preventive maintenance, and by reducing MTTR through good diagnostics, modular design, spare parts holding, trained staff, clear procedures and fast access. Adding redundancy improves system availability even when individual items fail.
References
- IEC 60050-192:2015, International Electrotechnical Vocabulary: Dependability
- P. D. T. O'Connor and A. Kleyner, Practical Reliability Engineering, 5th ed., Wiley
- C. E. Ebeling, An Introduction to Reliability and Maintainability Engineering, 3rd ed., Waveland Press
- MIL-HDBK-338B, Electronic Reliability Design Handbook, U.S. Department of Defense
- EN 15341:2019, Maintenance: Maintenance Key Performance Indicators
Get one engineering email a week
New articles, worked examples and study notes every week. Free, no spam, unsubscribe any time.