Pulse Oximeter Working Principle: How SpO2 Is Measured
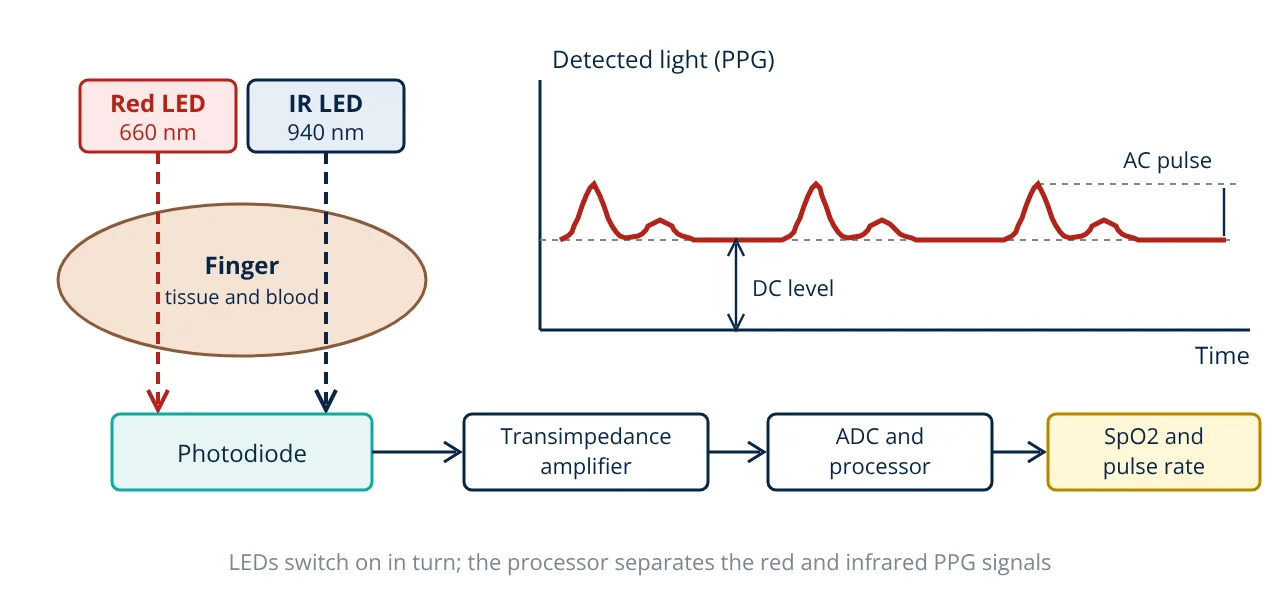
The pulse oximeter working principle combines two ideas: spectrophotometry and photoplethysmography. Red light (about 660 nm) and infrared light (about 940 nm) are passed through a finger or earlobe, and a photodiode measures how much of each gets through. Only the part of the signal that pulses with each heartbeat comes from arterial blood, so the device compares the pulsatile absorption at the two wavelengths and converts that ratio into SpO2, the estimated arterial oxygen saturation, using an empirical calibration curve.
Pulse oximetry is one of the most used monitoring methods in medicine. The WHO Pulse Oximetry Training Manual describes it as a standard monitor in anaesthesia and critical care, and small fingertip devices are now common in clinics and homes. For engineers, it is a neat example of an optical sensor, an analog front end and signal processing working together, and it builds directly on the ideas in biopotential measurement basics.
What a pulse oximeter measures
Haemoglobin in red blood cells carries oxygen. Oxygen saturation is the fraction of haemoglobin that is oxygenated:
where HbO2 is oxygenated haemoglobin and Hb is deoxygenated (reduced) haemoglobin. When this is measured on an arterial blood sample with a laboratory CO-oximeter it is called SaO2. When it is estimated through the skin by a pulse oximeter it is called SpO2. The device also reports pulse rate, taken from the time between pulses in the optical signal.
Pulse oximeter working principle step by step
1. Light absorption by haemoglobin
The method rests on the Beer-Lambert law, which states that the absorbance of light passing through a medium is proportional to the concentration of the absorbing substance and the path length. The same law is used in a spectrophotometer. Webster’s Design of Pulse Oximeters explains that HbO2 and Hb have different absorption spectra:
- At red wavelengths near 660 nm, deoxygenated haemoglobin absorbs much more light than oxygenated haemoglobin.
- At infrared wavelengths near 940 nm, oxygenated haemoglobin absorbs slightly more than deoxygenated haemoglobin.
Because the two forms behave in opposite ways at the two wavelengths, the ratio of red to infrared absorption changes strongly with saturation.
2. Separating arterial blood from everything else
Light passing through a finger is absorbed by skin, bone, tissue, venous blood and arterial blood. Most of these absorb a constant amount. Arterial blood volume, however, rises and falls with every heartbeat as the arteries expand. The detected light therefore has two parts:
- A large, steady DC component from tissue, bone, venous blood and the non pulsatile part of arterial blood.
- A small AC component that pulses at the heart rate. It comes only from the changing volume of arterial blood.
This pulsatile optical signal is the photoplethysmogram (PPG). By using only the AC part, the oximeter isolates arterial blood without knowing the absorption of the tissue.
3. Time multiplexed LEDs and one detector
A typical transmission probe has a red LED and an infrared LED on one side of the finger and a single silicon photodiode on the other. Webster describes how the LEDs are switched on in turn, with a dark period in which both are off. The dark period measures ambient light so it can be subtracted. A transimpedance amplifier turns the photodiode current into a voltage, which is filtered and digitised. Since a photodiode has a broad spectral response, multiplexing in time is what lets one detector measure both wavelengths.
4. The ratio of ratios
For each wavelength the processor divides the AC amplitude by the DC level. This normalisation cancels the effect of LED brightness, skin thickness and detector gain. The two normalised values are then divided to give the ratio of ratios R:
As saturation falls, red absorption by Hb rises, so the red AC component grows relative to the infrared one and R increases.
5. Calibration curve
Light in tissue scatters, so the simple Beer-Lambert law does not give SpO2 directly from R. Webster explains that manufacturers build an empirical calibration curve by recording R from healthy volunteers while a CO-oximeter measures SaO2 on arterial samples as the inspired oxygen is lowered in controlled steps. The resulting curve, stored as a lookup table or polynomial, maps R to SpO2. Texas Instruments application report SLAA274 uses a simple linear approximation for a demonstration design:
This is suitable only for learning. Clinical devices use their own validated curves.
Accuracy and limitations
ISO 80601-2-61:2017 is the international safety and performance standard for pulse oximeter equipment. It requires manufacturers to state SpO2 accuracy as a root mean square difference (Arms) against SaO2 from controlled desaturation studies, and it sets a maximum Arms of 4 percent over the range 70 to 100 percent SpO2. Factors that reduce accuracy, described in the WHO manual and the FDA safety communication, include:
- Poor perfusion: cold hands, shock or vasoconstriction make the AC signal very small.
- Motion artefact: movement changes the optical path and can mimic a pulse.
- Dyshaemoglobins: carboxyhaemoglobin and methaemoglobin are not separated by two wavelength devices.
- Skin pigmentation: the FDA noted in 2021 that pulse oximeters may be less accurate in people with darker skin pigmentation.
- Nail polish and ambient light: some dark nail polish absorbs light, and bright room light can saturate the detector.
- Low saturation: calibration data are sparse below 70 percent, so readings there are less reliable.
Worked example: SpO2 from a PPG signal
- Given
- Red channel: AC = 12 mV peak to peak, DC = 1.20 V. Infrared channel: AC = 20 mV peak to peak, DC = 1.00 V. Pulses detected every 0.80 s.
- Find
- Ratio of ratios R, estimated SpO2 and pulse rate.
- Assumptions
- Clean signals after ambient light subtraction; the linear demonstration calibration SpO2 = 110 - 25R from TI SLAA274 applies.
- Solution
- Red AC/DC = 0.012 / 1.20 = 0.0100
IR AC/DC = 0.020 / 1.00 = 0.0200
R = 0.0100 / 0.0200 = 0.50
SpO2 = 110 - 25 × 0.50 = 97.5 percent
Pulse rate = 60 / 0.80 = 75 beats per minute - Answer
- R = 0.50, SpO2 about 97.5 percent, pulse rate 75 bpm
- Limitations
- The linear curve is a teaching approximation. A real device uses its own calibration from desaturation studies, averages over several seconds and rejects motion artefacts.
Notice that the AC components are only about 1 to 2 percent of the DC levels. That is why the analog front end needs low noise and good ambient light rejection, and why the signal is filtered and averaged.
Types of pulse oximeter probes
| Type | Arrangement | Typical sites | Notes |
|---|---|---|---|
| Transmission | LEDs and detector on opposite sides | Finger, toe, earlobe | Most common; strong signal through thin tissue |
| Reflectance | LEDs and detector side by side on the skin | Forehead, wrist, chest | Used in wearables; smaller AC signal |
| Disposable adhesive | Transmission sensor on a sticky strip | Neonatal foot, finger | Single patient use, good for long monitoring |
| Reusable clip | Spring clip with soft pads | Adult finger | Spot checks and ward monitoring |
Design points for engineers
- LED drive: constant current pulses, with adjustable intensity so the DC level sits in the ADC range for thin and thick fingers.
- Front end: a transimpedance amplifier with a large feedback resistor converts nanoamp to microamp currents into volts. Ambient light is subtracted using the dark phase.
- Sampling: the PPG has most of its energy at low frequencies, so moderate sampling rates are enough, but the sampling theorem still sets the minimum rate after filtering.
- Processing: band pass filtering, peak detection, AC and DC estimation, averaging and signal quality checks before a value is displayed.
- Regulation: pulse oximeters for clinical use are regulated medical devices. Their class depends on the market, as explained in medical device classification.
Applications
- Continuous monitoring during anaesthesia, recovery and intensive care.
- Spot checks in wards, clinics, ambulances and triage.
- Home monitoring of people with lung or heart disease on medical advice.
- Sleep studies, where SpO2 dips are recorded overnight.
- Wearable fitness devices using reflectance sensors, which are generally not validated to clinical standards.
Related reading
Frequently asked questions
Why does a pulse oximeter use two wavelengths of light?
Oxygenated and deoxygenated haemoglobin absorb red and infrared light differently. Deoxygenated haemoglobin absorbs more red light, while oxygenated haemoglobin absorbs more infrared light. Comparing the pulsatile absorption at the two wavelengths lets the device estimate the fraction of haemoglobin that carries oxygen. One wavelength alone cannot separate the two forms.
What is the difference between SpO2 and SaO2?
SaO2 is arterial oxygen saturation measured directly on an arterial blood sample with a CO-oximeter, which is the reference method. SpO2 is the estimate of the same quantity made non invasively by a pulse oximeter. Pulse oximeters are calibrated against SaO2 data from controlled studies, so SpO2 is only as good as that calibration and the signal quality.
Can a pulse oximeter detect carbon monoxide poisoning?
A standard two wavelength pulse oximeter cannot. Carboxyhaemoglobin absorbs red light in a similar way to oxygenated haemoglobin, so the device can show a normal or high SpO2 while the blood carries much less oxygen. Detecting carboxyhaemoglobin needs a multi wavelength CO-oximeter.
References
- ISO 80601-2-61:2017 Medical electrical equipment, Part 2-61: Particular requirements for basic safety and essential performance of pulse oximeter equipment
- J. G. Webster (ed.), Design of Pulse Oximeters, Institute of Physics Publishing, 1997
- J. G. Webster (ed.), Medical Instrumentation: Application and Design, 4th ed., Wiley, 2010
- World Health Organization, WHO Pulse Oximetry Training Manual, 2011
- U.S. Food and Drug Administration, Pulse Oximeter Accuracy and Limitations: FDA Safety Communication, 2021
- Texas Instruments, Application Report SLAA274, Single-Chip Pulse Oximeter Design Using the MSP430
Get one engineering email a week
New articles, worked examples and study notes every week. Free, no spam, unsubscribe any time.