Spectrophotometer Working Principle and Beer-Lambert Law
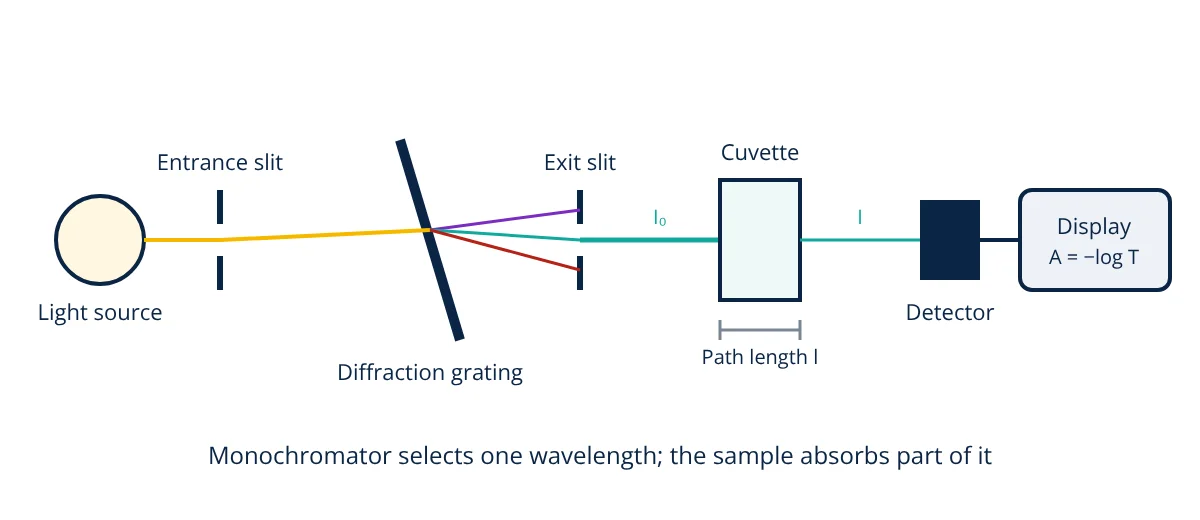
The spectrophotometer working principle is to pass light of a selected wavelength through a sample and measure how much is absorbed. A light source (deuterium lamp for UV, tungsten halogen for visible, or a xenon flash lamp) produces broad spectrum light; a monochromator (diffraction grating and slits) selects a narrow wavelength band; the beam passes through a cuvette holding the sample; and a detector (photodiode, photodiode array or photomultiplier) measures transmitted intensity. Transmittance T = I/I₀ and absorbance A = −log₁₀T. The Beer-Lambert law, A = ε l c, relates absorbance to concentration, so unknown concentrations can be found from a calibration curve.
Spectrophotometers are among the most widely used instruments in hospitals, biology and chemistry labs, pharmaceutical quality control, food testing and environmental monitoring. They measure DNA and protein concentrations, enzyme activities, blood chemistry, drug purity, water quality and colour, quickly and without consuming much sample.
Light and absorption
Molecules absorb light at specific wavelengths when the photon energy matches an electronic transition. In the ultraviolet (UV, about 190 to 400 nm) and visible (about 400 to 800 nm) regions, absorption comes from electrons in conjugated systems, aromatic rings and coloured compounds. The pattern of absorbance versus wavelength is the absorption spectrum, and the wavelength of maximum absorbance, λmax, is usually chosen for quantitative work because it gives the highest sensitivity and least sensitivity to small wavelength errors.
Examples: nucleic acids at 260 nm, proteins at 280 nm (from tryptophan and tyrosine), NADH at 340 nm, haemoglobin around 415 nm.
Spectrophotometer working principle: main components
- Light source: deuterium lamp (UV, about 190 to 400 nm), tungsten halogen lamp (visible and near IR), or a pulsed xenon lamp covering both. Many instruments switch lamps automatically.
- Monochromator: entrance slit, collimating optics, diffraction grating that spreads light into its wavelengths, and exit slit that selects a narrow band (spectral bandwidth often 1 to 5 nm). Simple colorimeters use coloured filters or LEDs instead.
- Sample holder: a cuvette, typically with a 10 mm (1 cm) path length; quartz for UV, glass or plastic for visible. Microvolume instruments measure 1 to 2 µL drops with very short paths.
- Detector: silicon photodiodes, photodiode arrays (which capture a whole spectrum at once in array instruments) or photomultiplier tubes for very low light.
- Electronics and software: convert detector current to transmittance and absorbance, store spectra and calibrations.
Single beam and double beam
Single beam instruments measure a blank (reference) first and then the sample; they are simple and sensitive but affected by lamp drift. Double beam instruments split the light between sample and reference cuvettes simultaneously, compensating for source and detector drift, which is better for long runs and scanning spectra.
Transmittance, absorbance and the Beer-Lambert law
where ε is the molar absorptivity (L mol⁻¹ cm⁻¹), l the path length (cm) and c the molar concentration (mol/L). An absorbance of 1 means only 10% of light is transmitted; 2 means 1%.
Deviations from the law
The law holds best for dilute solutions, monochromatic light and non-scattering samples. Deviations arise from high concentrations (molecular interactions), chemical changes such as pH dependent equilibria, stray light, wide spectral bandwidth relative to absorption peaks, and turbid samples that scatter light.
Calibration curve method
- Prepare a blank containing everything except the analyte, and set the instrument to zero absorbance.
- Prepare a series of standards of known concentration.
- Measure their absorbance at λmax and plot absorbance against concentration.
- Fit a straight line; check linearity (for example R² above 0.995).
- Measure the unknown and calculate its concentration from the line, diluting if absorbance is outside the linear range.
- Given
- A DNA sample diluted 1 in 50 gives A₂₆₀ = 0.42 in a 1 cm cuvette. For double stranded DNA, A₂₆₀ = 1.0 corresponds to 50 µg/mL. A₂₈₀ of the same dilution is 0.23. Separately, a dye with ε = 15 000 L mol⁻¹ cm⁻¹ shows A = 0.60 in a 1 cm cuvette.
- Find
- The DNA concentration, the A260/A280 purity ratio, the dye concentration and the transmittance of the dye sample.
- Assumptions
- Measurements within the linear range; blank subtracted.
- Solution
- DNA in cuvette = 0.42 × 50 = 21 µg/mL; original = 21 × 50 = 1050 µg/mL ≈ 1.05 mg/mL
Purity ratio = 0.42 ÷ 0.23 = 1.83
Dye: c = A ÷ (ε l) = 0.60 ÷ 15 000 = 4.0 × 10⁻⁵ mol/L = 40 µmol/L
T = 10^(−0.60) = 0.251, so 25.1% transmitted - Answer
- DNA about 1.05 mg/mL with A260/A280 of 1.83 (reasonably pure; about 1.8 is expected for clean DNA); dye 40 µmol/L with 25% transmittance
- Limitations
- Contaminants absorbing at 260 nm, such as RNA or nucleotides, inflate DNA estimates; fluorescence methods are more specific.
Applications
- Clinical chemistry: glucose, cholesterol, creatinine, enzymes and haemoglobin, often in automated analysers using colour forming reactions.
- Molecular biology: DNA, RNA and protein quantification; bacterial growth monitoring by optical density at 600 nm, as in bioreactor cultures.
- Enzyme kinetics: following absorbance change over time.
- Pharmaceutical QC: assay and dissolution testing of drugs.
- Environmental testing: nitrate, phosphate, ammonia and metals in water using colorimetric methods, linked to water treatment monitoring.
- Industrial: colour measurement and online analysers in process plants, such as water quality analysers that measure colour or chemical concentration in a flowing sample.
Advanced spectrophotometers
Beyond basic UV-Vis instruments, diode array spectrophotometers capture complete spectra in a fraction of a second, which suits kinetics and chromatography detectors. Microplate readers measure 96 or 384 samples automatically for high throughput assays. Fibre optic probes bring measurements into reactors and process lines, and near infrared and fluorescence spectrometers extend the same ideas to other wavelengths and much higher sensitivity.
Good practice
Record the instrument, wavelength, bandwidth, path length and blank used with every result, so measurements can be reproduced and audited.
Warm up lamps, use matched and clean cuvettes, handle them by the frosted sides, check for bubbles, use the correct blank, verify wavelength accuracy and photometric accuracy with certified reference materials such as holmium oxide filters and potassium dichromate solutions, and keep absorbance readings in the linear range. Following the spectrophotometer working principle and these practices gives fast, accurate and reliable measurements.
Frequently asked questions
Why is absorbance used instead of transmittance?
Absorbance is directly proportional to concentration and path length according to the Beer-Lambert law, so calibration curves are straight lines. Transmittance falls exponentially with concentration, which is harder to use. Absorbance A equals minus log10 of transmittance T.
What absorbance range gives the most accurate results?
Most instruments are most accurate between about 0.1 and 1.0 absorbance units. Below about 0.1, the small difference between sample and reference light is hard to measure precisely; above about 1 to 2, very little light reaches the detector and stray light causes errors. Samples are diluted or the path length changed to stay in range.
Why do quartz cuvettes cost more than plastic ones?
Glass and most plastics absorb ultraviolet light below about 300 to 340 nm, so they cannot be used for UV measurements such as DNA at 260 nm or protein at 280 nm. Quartz (fused silica) transmits down to about 190 nm, making it essential for UV work, but it is more expensive and fragile.
References
- D. A. Skoog, F. J. Holler and S. R. Crouch, Principles of Instrumental Analysis, 7th ed., Cengage
- D. C. Harris, Quantitative Chemical Analysis, 10th ed., W. H. Freeman
- United States Pharmacopeia General Chapter 857, Ultraviolet-Visible Spectroscopy
- ASTM E275, Standard Practice for Describing and Measuring Performance of Ultraviolet and Visible Spectrophotometers
- European Pharmacopoeia 2.2.25, Absorption spectrophotometry, ultraviolet and visible
Get one engineering email a week
New articles, worked examples and study notes every week. Free, no spam, unsubscribe any time.