Precision Agriculture Technologies Explained
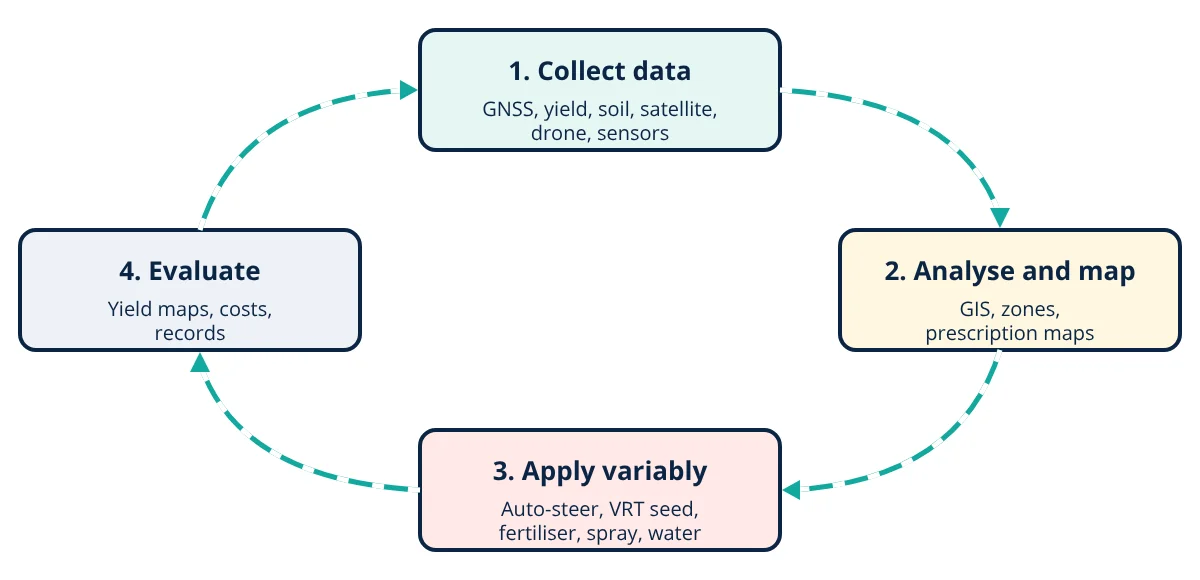
Precision agriculture is a management strategy that uses data and technology to manage crops and soils according to the variation within each field. GNSS guidance with RTK, yield and soil maps, satellite and drone imagery assessed with indices such as NDVI, and variable rate technology let farmers apply seed, fertiliser, water and chemicals only where needed.
No field is uniform. Soil texture, organic matter, nutrients, drainage, slope and pest pressure vary from place to place, so crop yield varies too. Conventional farming applies the same inputs everywhere, over-supplying some areas and under-supplying others. Precision agriculture, defined by the International Society of Precision Agriculture as a management strategy that uses data to support decisions according to estimated variability, aims to do the right thing, in the right place, at the right time and in the right amount.
The precision agriculture cycle
1. Positioning and guidance
Global navigation satellite systems (GNSS), including GPS, GLONASS, Galileo, BeiDou and India’s NavIC, give machine positions. Accuracy levels:
- Standalone GNSS: about 1 to 3 m, adequate for mapping and scouting.
- SBAS corrections (such as GAGAN in India, WAAS, EGNOS): about 0.5 to 1 m.
- RTK (real time kinematic): about 2 cm, using a local base station or network.
Uses include auto-steering (reduces overlap and gaps, operator fatigue and night work errors), section control that switches sprayer or planter sections off over already treated areas or headlands, and controlled traffic farming, where machines always use the same wheel tracks to limit soil compaction.
2. Mapping variability
- Yield monitoring: sensors on combine harvesters measure grain flow and moisture, linked to GNSS position, producing yield maps that show which zones perform well or poorly year after year.
- Soil sampling: grid or zone sampling with laboratory analysis of pH, nutrients and organic matter.
- Soil sensors: electrical conductivity (EC) sensors, gamma radiometrics and optical sensors map texture and properties continuously.
- Topography from RTK or LiDAR identifies wet hollows and slopes.
3. Remote sensing and vegetation indices
Healthy vegetation reflects strongly in near infrared (NIR) and absorbs red light for photosynthesis. The normalised difference vegetation index combines the two:
NDVI ranges from −1 to +1; dense, healthy crops are typically 0.6 to 0.9, stressed or sparse crops lower, and bare soil about 0.1 to 0.2. Satellites such as Sentinel-2 provide free 10 m imagery every few days; drones with multispectral cameras give centimetre resolution on demand. Other indices such as NDRE (red edge) are more sensitive in dense canopies. Thermal cameras detect water stress.
4. Variable rate technology (VRT)
Controllers on ISOBUS (ISO 11783) compatible tractors read prescription maps and adjust rates in real time:
- Variable rate seeding: higher density on productive soils, lower on poor ones.
- Variable rate fertiliser and lime: based on soil tests, yield potential or crop sensors that measure canopy greenness on the go.
- Targeted spraying: camera based “see and spray” systems detect weeds and spray only them, cutting herbicide use dramatically.
- Variable rate irrigation: centre pivots adjust nozzles by zone, linked to automated irrigation control.
5. Sensors, IoT and data platforms
Wireless soil moisture probes, weather stations, crop and livestock sensors and machine telematics send data to cloud platforms. Farm management information systems combine maps, operations records, costs and agronomic models. Machine learning, discussed in supervised vs unsupervised learning, helps predict yields, detect diseases from images and recommend actions.
6. Drones and robotics
Drones scout fields, map crops and increasingly spray pesticides and fertilisers on small plots and difficult terrain, subject to aviation and pesticide rules. Field robots weed mechanically or with lasers, and autonomous tractors are being trialled. Robotics overlaps with types of industrial robots and machine vision components.
- Given
- A drone multispectral image of a wheat field gives reflectance values in two zones: zone A, NIR = 0.48 and Red = 0.06; zone B, NIR = 0.32 and Red = 0.12. A nitrogen prescription uses 40 kg N/ha where NDVI is above 0.7 and 60 kg N/ha where it is between 0.4 and 0.7. Each zone covers 5 ha. The uniform rate would be 60 kg N/ha everywhere.
- Find
- NDVI of each zone, the variable rate total nitrogen, and the saving compared with the uniform rate.
- Assumptions
- Simplified two-zone rule; agronomist has validated thresholds for this crop stage.
- Solution
- Zone A: NDVI = (0.48 − 0.06) ÷ (0.48 + 0.06) = 0.42 ÷ 0.54 = 0.78
Zone B: NDVI = (0.32 − 0.12) ÷ (0.32 + 0.12) = 0.20 ÷ 0.44 = 0.45
Variable rate: 5 × 40 + 5 × 60 = 500 kg N
Uniform: 10 × 60 = 600 kg N; saving = 100 kg N (17%) - Answer
- Zone A NDVI 0.78 (healthy), zone B 0.45 (weaker); variable rate uses 500 kg N instead of 600 kg, a 17% saving
- Limitations
- Low NDVI can be caused by water stress, disease or soil problems rather than nitrogen shortage; ground truthing is essential.
Key formulas for precision agriculture
| Quantity | Formula | Symbols and units |
|---|---|---|
| Vegetation index | NDVI = (NIR - Red) ÷ (NIR + Red) | NIR, Red = reflectance in near infrared and red bands (fractions); NDVI from -1 to +1 |
| Variable rate total input | Total = sum of (zone area × zone rate) | area in ha, rate in kg/ha, total in kg |
| Input saving | Saving = uniform total - variable rate total | kg; divide by uniform total for percent |
Benefits and challenges of precision agriculture
Benefits: higher input efficiency, lower costs, better yields in responsive zones, reduced nutrient and pesticide losses to water and air, less soil compaction, better records for traceability and certification, and reduced operator fatigue.
Challenges: equipment and subscription costs, connectivity in rural areas, data compatibility between brands, skills to interpret data, data ownership questions and small, fragmented fields in many countries. Services offered by cooperatives, start-ups and machinery hire centres help overcome these barriers.
Getting started
The key is to start with a clear question, such as where yields are lowest and why.
Begin with guidance and section control, which pay back quickly through input savings, then add yield mapping and soil sampling to understand variability, and move to variable rate application once zones are reliable. Water management through efficient methods such as those in drip vs sprinkler irrigation is another high value area for precision agriculture.
Precision agriculture interview and viva questions
- What does RTK add to standard GNSS? Real time kinematic positioning corrects satellite signals with a nearby base station or network, improving accuracy from about 1 to 3 m standalone to about 2 cm.
- Why does NDVI indicate crop health? Healthy vegetation reflects strongly in near infrared and absorbs red light for photosynthesis, so dense, healthy crops give NDVI of about 0.6 to 0.9 while stressed crops and bare soil give lower values.
- What is a prescription map? It is a map of application rates by zone that a controller on an ISOBUS compatible tractor reads to adjust seed, fertiliser or spray rates in real time.
- What is controlled traffic farming? Machines always use the same wheel tracks, guided by accurate GNSS, which limits soil compaction to those tracks.
- Why must low NDVI zones be ground truthed before applying more nitrogen? Low NDVI can be caused by water stress, disease or soil problems rather than nitrogen shortage, so field checks are needed before changing the prescription.
Frequently asked questions
What is the main benefit of precision agriculture?
It lets farmers manage variation within fields instead of treating every part the same. Applying seed, fertiliser, water and chemicals where and when they are needed improves yields in strong zones, saves inputs in weak zones, reduces overlap and environmental losses, and gives data for better decisions.
What is RTK and why is it important?
Real time kinematic positioning corrects satellite signals using a nearby base station or network, improving tractor position accuracy from about a metre with standard GNSS to about 2 cm. This accuracy allows repeatable rows, controlled traffic farming, precise planting and mechanical weeding close to crops.
Is precision agriculture only for large farms?
No, although large farms adopted it first. Smartphone apps, satellite imagery services, low cost guidance kits, drone spraying services and custom hiring of equipment make precision tools accessible to smallholders. In many regions, farmer producer organisations and service providers share the cost.
References
- International Society of Precision Agriculture (ISPA), Definition of Precision Agriculture, 2019
- J. V. Stafford (ed.), Precision Agriculture for Sustainability, Burleigh Dodds Science Publishing, 2019
- Q. Zhang (ed.), Precision Agriculture Technology for Crop Farming, CRC Press, 2016
- J. W. Rouse et al., Monitoring vegetation systems in the Great Plains with ERTS, NASA SP-351, 1974
- ISO 11783 (ISOBUS), Tractors and machinery for agriculture and forestry: Serial control and communications data network
Get one engineering email a week
New articles, worked examples and study notes every week. Free, no spam, unsubscribe any time.