Solar Panel Efficiency: Factors and Calculation
Solar panel efficiency is the fraction of sunlight power falling on a panel that it converts into electrical power. It is calculated as maximum power divided by irradiance times module area, measured at standard test conditions (1000 W/m², 25 °C cell temperature, AM1.5 spectrum). Real output is lower than the rating because cells run hot, sunlight varies, and dust, shading and wiring add losses.
Solar panel efficiency decides how many watts a given roof or ground area can produce. A more efficient module produces the same power from a smaller area, which saves mounting structure, cabling and land. Efficiency is also widely misunderstood: the number on a datasheet is a laboratory rating, and the panel rarely works at exactly those conditions. This article explains how efficiency is defined and measured, what reduces it in the field and how to estimate real output. For the full system picture, see how solar PV systems work.
How solar panel efficiency is calculated
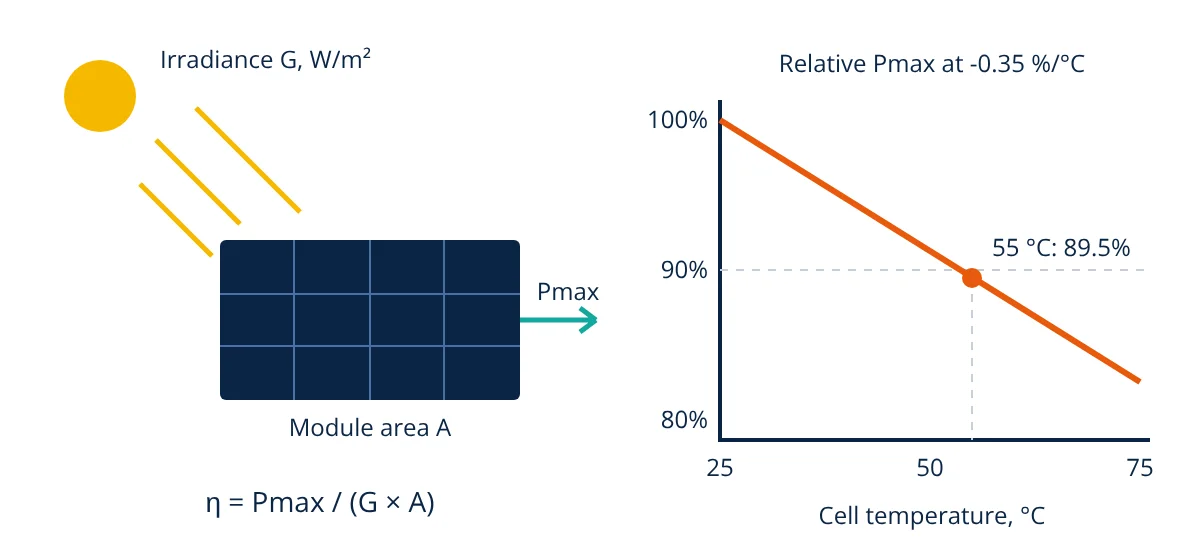
Module efficiency is the ratio of electrical output to incident solar power:
where Pmax is the maximum power output (W), G is the irradiance on the module plane (W/m²) and A is the total module area including the frame (m²).
Because output depends strongly on conditions, ratings are measured at standard test conditions (STC), used in IEC 61215 type testing and IEC 60904 measurement standards:
- Irradiance of 1000 W/m² on the module plane.
- Cell temperature of 25 °C.
- Reference solar spectrum AM1.5 (air mass 1.5), defined in IEC 60904-3.
The rated power at STC is the “peak watt” (Wp) value printed on the nameplate. IEC 61853-1 extends the rating to a matrix of irradiances and temperatures, which gives a better picture of real performance.
Cell efficiency versus module efficiency
Cell efficiency is measured on a single solar cell. Module efficiency is always lower, because a module includes gaps between cells, the frame, busbars and glass reflection, and small resistive and mismatch losses between cells. When comparing panels, use module efficiency from the datasheet, since that is what determines output per square metre of roof.
There is also a physical upper limit. Shockley and Queisser showed in 1961 that a single junction cell cannot convert all of sunlight: photons with less energy than the band gap pass through unused, and the excess energy of high energy photons is lost as heat. For single junction cells under standard sunlight the limit is about one third. Multi junction cells, which stack materials with different band gaps, can exceed it but are expensive and mainly used in space and concentrator systems.
Most panels today use crystalline silicon cells, with monocrystalline cells giving higher efficiency than polycrystalline ones. Thin film technologies such as cadmium telluride and CIGS are also used. Cell structures such as passivated emitter and rear cell (PERC), tunnel oxide passivated contact (TOPCon) and heterojunction (HJT) improve efficiency by reducing recombination losses at the surfaces.
Reading the I-V curve: where Pmax comes from
A module’s current and voltage are linked by its current voltage (I-V) curve. At one end is the short circuit current Isc, with zero voltage; at the other is the open circuit voltage Voc, with zero current. Neither point delivers power. Between them lies the maximum power point, where the product of voltage Vmp and current Imp is largest:
The fill factor FF describes how square the curve is. A higher fill factor means lower internal resistive losses and leakage, and therefore higher efficiency for the same Voc and Isc. All four values are listed on the datasheet at STC, so the fill factor can be checked by dividing Pmax by Voc times Isc.
In operation, the inverter’s maximum power point tracker (MPPT) continuously adjusts the operating voltage to stay near Vmp as irradiance and temperature change. A tracker that drifts off the maximum power point wastes energy even when the module itself is performing well. Laboratory efficiency is measured with a calibrated solar simulator that sweeps the full I-V curve under controlled STC conditions.
Factors that affect solar panel efficiency in the field
Cell temperature. Silicon cell voltage falls as temperature rises, so power falls too. The temperature coefficient of Pmax, given on every datasheet, is typically about -0.3 to -0.5 percent per °C for crystalline silicon. Cells in sunlight run well above air temperature. A common estimate from Masters uses the nominal operating cell temperature (NOCT), measured at 800 W/m², 20 °C ambient and 1 m/s wind:
With a NOCT of 45 °C, this formula puts the cell about 25 °C above ambient at 800 W/m².
Irradiance level. Power is roughly proportional to irradiance, while efficiency changes only a little at moderate irradiance and falls at very low light.
Spectrum and angle. Morning and evening light passes through more air, shifting the spectrum. Light striking the glass at a steep angle is partly reflected.
Shading. Shading even part of one cell can sharply cut the output of a whole string of cells. Bypass diodes limit the loss and protect shaded cells from overheating, and module level electronics such as optimisers and microinverters, discussed in solar inverter types, reduce mismatch losses.
Soiling. Dust, bird droppings, pollen and snow block light. Losses depend strongly on site, tilt and rainfall, so cleaning schedules are site specific.
Degradation. Output falls slowly with age. Jordan and Kurtz reported a median rate of about 0.5 percent per year for crystalline silicon modules in the field.
System losses. Cable resistance, module mismatch and inverter conversion losses reduce the energy delivered, even though they do not change module efficiency itself.
- Given
- A 400 Wp module measuring 1.722 m by 1.134 m, temperature coefficient of Pmax -0.35 %/°C, NOCT 45 °C. Field conditions: irradiance 800 W/m², ambient temperature 30 °C.
- Find
- The STC module efficiency and the estimated output under the field conditions.
- Assumptions
- Power proportional to irradiance; linear temperature coefficient; no shading, soiling or wiring losses.
- Solution
- Area A = 1.722 × 1.134 = 1.953 m²
η at STC = 400 / (1000 × 1.953) = 0.205, so 20.5 percent
Cell temperature = 30 + (45 − 20) / 800 × 800 = 55 °C
P = 400 × (800 / 1000) × (1 − 0.0035 × (55 − 25)) = 320 × 0.895 = 286.4 W - Answer
- Module efficiency 20.5 percent at STC; about 286 W in the field, an effective efficiency of about 18.3 percent
- Limitations
- The NOCT model ignores wind and mounting differences, and real systems also lose energy to soiling, mismatch, cables and the inverter.
How to get the most from solar panel efficiency
- Choose an orientation and tilt that maximise annual irradiance and avoid shading from nearby objects.
- Leave an air gap behind roof mounted modules so they run cooler.
- Compare temperature coefficients, not only STC efficiency, for hot climates.
- Plan cleaning based on observed soiling at the site.
- Monitor string and inverter output so faults show up early, and review consumption with an energy audit before sizing the system.
Frequently asked questions
Is a higher efficiency solar panel always better?
Not always. Higher efficiency means more watts from the same area, which matters on small or crowded roofs. Where space is plentiful, lower efficiency panels with a lower cost per watt can give cheaper energy. Compare the cost per watt, the temperature coefficient, the warranty and the degradation rate as well as the efficiency.
Why do solar panels produce less than their rated power?
The rating is measured at standard test conditions: 1000 W/m², 25 °C cell temperature and the AM1.5 spectrum. In the field, cells usually run hotter than 25 °C, irradiance is often lower, and dust, shading, wiring losses, mismatch and inverter losses reduce the output further.
Does solar panel efficiency fall over time?
Yes, slowly. A review of field data by Jordan and Kurtz at NREL found a median degradation rate of about 0.5 percent per year for crystalline silicon modules. Manufacturers give a performance warranty that states the minimum output after a stated number of years.
References
- IEC 61215-1:2021 Terrestrial photovoltaic (PV) modules, Design qualification and type approval, Part 1: Test requirements
- IEC 60904-3:2019 Photovoltaic devices, Part 3: Measurement principles for terrestrial PV solar devices with reference spectral irradiance data
- IEC 61853-1:2011 Photovoltaic (PV) module performance testing and energy rating, Part 1: Irradiance and temperature performance measurements and power rating
- G. M. Masters, Renewable and Efficient Electric Power Systems, 2nd ed., Wiley-IEEE Press, 2013
- D. C. Jordan and S. R. Kurtz, Photovoltaic Degradation Rates: An Analytical Review, Progress in Photovoltaics 21, 2013
- W. Shockley and H. J. Queisser, Detailed Balance Limit of Efficiency of p-n Junction Solar Cells, Journal of Applied Physics 32, 1961
Get one engineering email a week
New articles, worked examples and study notes every week. Free, no spam, unsubscribe any time.