Tensile Test: Procedure and Stress-Strain Curve
A tensile test pulls a standard specimen in a universal testing machine at a controlled rate until it breaks, recording load and elongation. From the stress-strain curve it gives the material’s Young’s modulus (stiffness), yield strength or 0.2% proof stress, ultimate tensile strength (UTS), elongation at fracture and reduction of area (ductility). The test follows standards such as ISO 6892-1 and ASTM E8 for metals, and its results are the basis for design stresses, material specifications and quality control.
The tensile test is the most common mechanical test. It tells engineers how strong, stiff and ductile a material is, and whether a batch of steel, aluminium or plastic meets its specification. The data feed directly into design calculations of stress and strain and the choice of a factor of safety.
Test equipment and specimen
- Universal testing machine (UTM): a loading frame driven by hydraulics or electromechanical screws, with a load cell to measure force, and grips to hold the specimen.
- Extensometer: clipped to the specimen to measure elongation accurately over a defined gauge length, especially for modulus and yield.
- Specimen: round or flat, with enlarged ends for gripping and a reduced parallel section. Proportional round specimens often use a gauge length L₀ = 5.65√S₀, equivalent to 5 times the diameter. Specimens are machined from plate, bar, castings or welded joints according to the product standard.
Procedure
- Measure the specimen’s original diameter or width and thickness, calculate the cross-sectional area S₀, and mark the gauge length.
- Mount the specimen in the grips, aligned with the load axis, and attach the extensometer.
- Apply load at a controlled strain or stress rate defined by the standard (slow in the elastic and yield region).
- Record force and extension continuously until fracture. The extensometer is usually removed after yield to protect it.
- Fit the broken pieces together and measure the final gauge length and the minimum cross-section at the neck.
- Calculate properties and report them with test temperature and specimen details.
The stress-strain curve
Engineering stress and strain are:
Elastic region
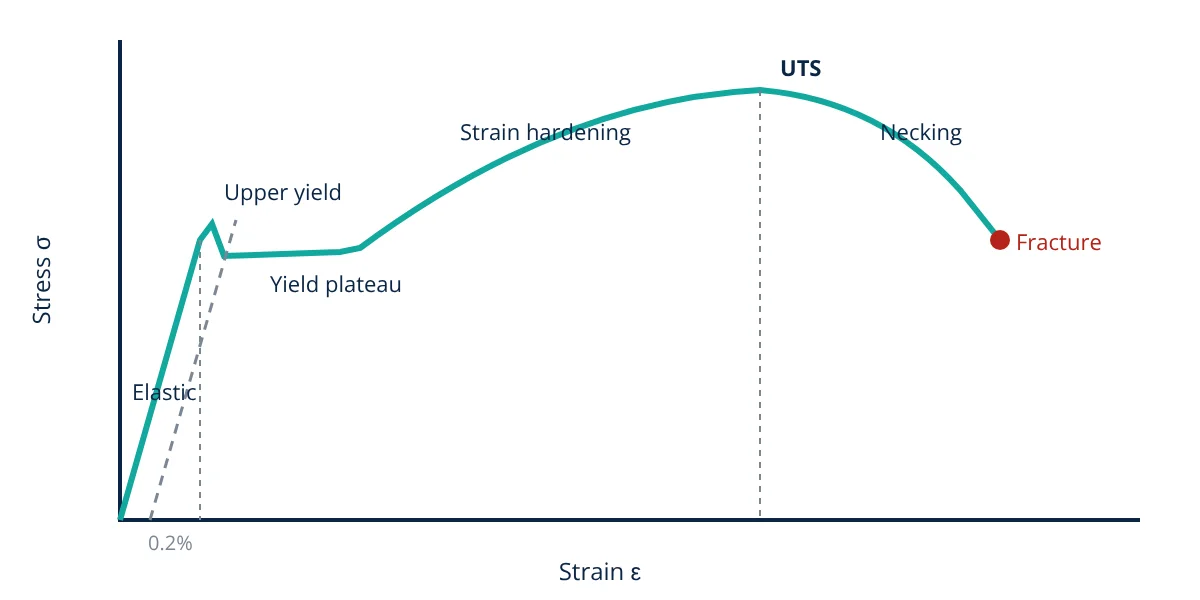
At low stress, stress is proportional to strain (Hooke’s law), and the specimen returns to its original length when unloaded. The slope is Young’s modulus:
Typical values: steel about 200 to 210 GPa, aluminium about 70 GPa, copper about 120 GPa.
Yield
Beyond the elastic limit, permanent (plastic) deformation begins. Low carbon steels show an upper yield point, a sudden drop, and a yield plateau (Lüders band propagation). Other materials yield gradually; the 0.2% proof stress (R_p0.2) is found by drawing a line parallel to the elastic slope from 0.2% strain and reading where it crosses the curve.
Strain hardening and UTS
After yielding, the metal strengthens as dislocations multiply and tangle (work hardening). Stress rises to a maximum, the ultimate tensile strength (R_m):
Necking and fracture
At the UTS, deformation concentrates in one region, which narrows (necking). Engineering stress falls because the load drops, although true stress in the neck continues to rise. The specimen finally fractures, typically with a cup and cone surface in ductile metals.
Ductility measures
where L_u is the final gauge length and S_u the minimum cross-section after fracture.
- Given
- A round steel specimen of 10.0 mm diameter and 50 mm gauge length. The 0.2% proof load is 27.5 kN, maximum load 38.5 kN. After fracture, the gauge length is 63.0 mm and the neck diameter is 6.2 mm. In the elastic range, a load of 15.7 kN gave an extension of 0.0476 mm.
- Find
- Young’s modulus, proof stress, UTS, elongation and reduction of area.
- Assumptions
- Engineering stress and strain; extension measured by extensometer.
- Solution
- S₀ = π × 10² ÷ 4 = 78.54 mm²
Elastic stress = 15 700 ÷ 78.54 = 199.9 MPa; strain = 0.0476 ÷ 50 = 0.000952; E = 199.9 ÷ 0.000952 = 210 000 MPa
R_p0.2 = 27 500 ÷ 78.54 = 350 MPa
R_m = 38 500 ÷ 78.54 = 490 MPa
A = (63.0 − 50) ÷ 50 = 26%
S_u = π × 6.2² ÷ 4 = 30.19 mm²; Z = (78.54 − 30.19) ÷ 78.54 = 61.6% - Answer
- E about 210 GPa, proof stress 350 MPa, UTS 490 MPa, elongation 26% and reduction of area 62%: a ductile structural steel
- Limitations
- Modulus from a standard tensile test is less accurate than dynamic methods; strain measurement errors strongly affect E.
True stress and true strain
Engineering values use the original area and length. True stress and true strain account for the changing dimensions: σ_true = σ(1 + ε) and ε_true = ln(1 + ε), valid up to the onset of necking. True stress-strain curves keep rising until fracture and are used in metal forming simulations and crash analysis. The strain hardening exponent n from the relation σ_true = Kε_trueⁿ indicates how well a sheet metal can be stretched without local thinning.
Factors affecting tensile test results
- Temperature: strength usually falls and ductility rises with temperature; some steels become brittle at low temperatures.
- Strain rate: faster testing raises yield strength in many metals.
- Specimen orientation: rolled and forged products can differ along and across the grain.
- Specimen preparation: machining marks or misalignment cause early failure.
- Heat treatment and microstructure, as explained in heat treatment of steel.
Using tensile test data
Test certificates (mill certificates) supplied with steel and other metals report these tensile results for each heat or batch.
Design codes use yield strength (with safety factors) for static design and UTS in some checks. Material standards specify minimum yield, UTS and elongation, for example S355 structural steel requires a minimum yield strength of 355 MPa for thinner sections. Elongation and reduction of area indicate formability and toughness. For repeated loads, tensile data are complemented by fatigue tests described in fatigue failure, and for brittle fracture risk by Charpy impact tests. Tensile testing is a destructive test; components in service are checked instead with NDT methods.
Frequently asked questions
What is the difference between engineering stress and true stress?
Engineering stress divides the load by the original cross-sectional area, while true stress divides it by the actual, shrinking area at each moment. After necking begins, engineering stress falls even though true stress keeps rising. Design normally uses engineering values; forming simulations use true stress and true strain.
Why do some materials not show a clear yield point?
Low carbon steels show a distinct yield point because dissolved carbon and nitrogen atoms pin dislocations until a higher stress frees them. Aluminium, copper, stainless steel and many high strength steels yield gradually, so a 0.2% offset yield strength (proof stress) is defined instead.
Which standards cover tensile testing of metals?
The most widely used are ISO 6892-1 for room temperature tensile testing of metallic materials and ASTM E8/E8M for metals in the USA. Plastics are tested to ISO 527 and ASTM D638, and composites to ISO 527-4/5 and ASTM D3039.
References
- ISO 6892-1:2019, Metallic materials: Tensile testing, Part 1: Method of test at room temperature
- ASTM E8/E8M-24, Standard Test Methods for Tension Testing of Metallic Materials
- G. E. Dieter, Mechanical Metallurgy, SI Metric ed., McGraw-Hill
- W. D. Callister Jr. and D. G. Rethwisch, Materials Science and Engineering: An Introduction, 10th ed., Wiley
Get one engineering email a week
New articles, worked examples and study notes every week. Free, no spam, unsubscribe any time.