Fatigue Failure: Causes, S-N Curve and Prevention
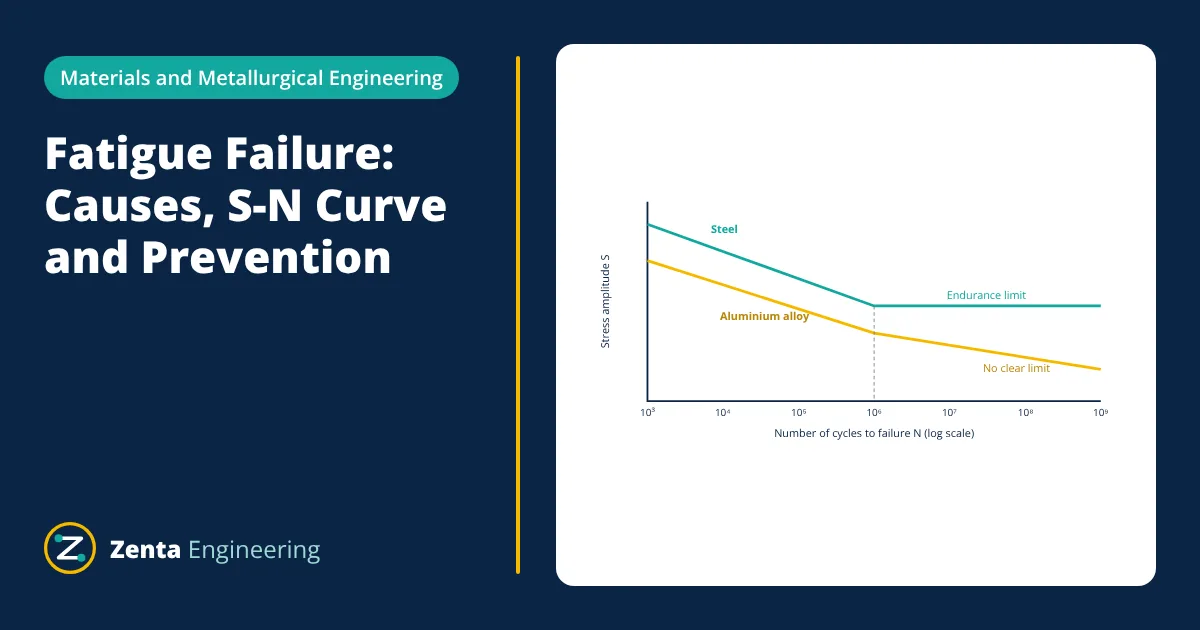
Fatigue failure is the progressive cracking and eventual fracture of a material under repeated or fluctuating stresses, often far below its yield strength. It happens in three stages: crack initiation at a stress concentration or surface flaw, crack propagation with each load cycle, and final fast fracture when the remaining section can no longer carry the load. Fatigue life is described by the S-N curve (stress amplitude versus cycles to failure); steels show an endurance limit below which life is practically infinite. Prevention focuses on lowering stress ranges, removing stress concentrations, improving surface finish, introducing compressive residual stress and inspecting for cracks.
Most mechanical failures in service are caused by fatigue. Rotating shafts, axles, crankshafts, springs, aircraft wings, bridges, offshore structures, pressure vessels under cyclic pressure and welded frames all experience fluctuating stresses. A part that is perfectly safe under a single static load can crack after millions of smaller cycles.
Cyclic stress parameters
For a stress cycling between σ_max and σ_min:
where σ_a is the stress amplitude, σ_m the mean stress and R the stress ratio. A rotating shaft under bending sees fully reversed stress (R = −1, σ_m = 0). Mean tensile stress reduces fatigue life.
Stages of fatigue failure
- Crack initiation: cyclic slip in favourably oriented grains forms tiny intrusions and extrusions at the surface, or a crack starts at an existing defect: a notch, scratch, inclusion, weld toe or corrosion pit.
- Crack propagation: the crack grows a small distance with each cycle, perpendicular to the main tensile stress. Growth rate follows the Paris law, da/dN = C(ΔK)^m, where ΔK is the stress intensity factor range.
- Final fracture: when the crack reaches a critical size, the remaining ligament fails suddenly by ductile overload or brittle fracture.
The fracture surface typically shows a smooth region with beach marks radiating from the origin, and a rougher final fracture zone. The relative size of the zones indicates the stress level: a small final zone means low nominal stress.
The S-N curve
Fatigue tests apply constant amplitude cycles to specimens at several stress levels and record cycles to failure. The resulting S-N (Wöhler) curve is usually plotted on log scales.
- Low cycle fatigue (below about 10³ to 10⁴ cycles) involves plastic strain and is analysed with strain based methods.
- High cycle fatigue (above about 10⁴ cycles) is mostly elastic and analysed with stress based S-N methods.
- For many steels, the endurance limit S_e′ for polished specimens is roughly half the ultimate tensile strength, up to about 700 MPa for UTS up to 1400 MPa.
The polished specimen limit is reduced for real parts by Marin factors for surface finish, size, loading type, temperature and reliability:
Effect of mean stress: the Goodman line
When mean stress is present, the modified Goodman criterion gives a safety factor n:
- Given
- A steel shaft has UTS 600 MPa. Its corrected endurance limit, after surface, size and reliability factors, is 190 MPa. At a fillet, the bending stress cycles between 40 MPa and 160 MPa after applying the fatigue stress concentration factor.
- Find
- Stress amplitude, mean stress and the Goodman safety factor.
- Assumptions
- Infinite life design; modified Goodman criterion.
- Solution
- σ_a = (160 − 40) ÷ 2 = 60 MPa
σ_m = (160 + 40) ÷ 2 = 100 MPa
1 ÷ n = 60 ÷ 190 + 100 ÷ 600 = 0.316 + 0.167 = 0.483
n = 2.07 - Answer
- Stress amplitude 60 MPa, mean 100 MPa, and a fatigue safety factor of about 2.1 for infinite life
- Limitations
- Real loading often varies in amplitude; cumulative damage methods such as Miner’s rule and rainflow counting are then needed.
Factors that reduce fatigue life
- Stress concentrations: holes, keyways, fillets, threads and abrupt changes in section raise local stress by the factor K_t.
- Surface condition: rough machining, scratches, decarburisation and corrosion pits act as crack starters.
- Size: larger parts contain more potential flaws.
- Welds: weld toes have sharp geometry and tensile residual stresses; welded joints are designed with dedicated detail categories from codes such as IIW and Eurocode 3.
- Environment: corrosion fatigue removes the endurance limit of steels; high temperature reduces strength.
- Tensile residual stress from welding or grinding.
Variable amplitude loading and Miner’s rule
Real components rarely see constant amplitude cycles. Wind, waves, traffic, machine start-ups and road roughness produce a spectrum of stress ranges. Engineers count cycles with rainflow counting and combine damage with the Palmgren-Miner rule: each block of n_i cycles at a stress level with life N_i uses a fraction n_i/N_i of the life, and failure is predicted when the fractions add up to 1. The rule is simple and widely used in codes, although load sequence effects mean real damage sums at failure can range from well below to above 1, so design codes include safety margins.
Preventing fatigue failure
- Design: generous fillet radii, gradual section changes, avoid notches in high stress areas, place holes and welds in low stress zones.
- Lower stress ranges: stiffen the structure, reduce vibration and dynamic loads, add damping.
- Surface improvements: polishing, grinding weld toes, avoiding sharp machining marks.
- Compressive residual stress: shot peening, rolling of fillets and threads, nitriding and induction hardening, discussed in heat treatment of steel.
- Materials: clean steels with few inclusions, higher strength materials where stress concentrations are controlled.
- Corrosion protection to avoid pits, as in types of corrosion.
- Inspection: periodic NDT methods to find cracks before they reach critical size, the basis of damage tolerant design in aircraft.
Fatigue failure in practice
Famous fatigue failures, from early railway axles in the 1840s to the de Havilland Comet aircraft in the 1950s, shaped modern engineering. Today, fatigue design combines S-N data, finite element stress analysis such as FEA, and realistic load spectra, applying an appropriate factor of safety. Good detailing and inspection remain the most effective defences against fatigue failure in real structures and machines.
Frequently asked questions
Why is fatigue failure dangerous?
Fatigue cracks grow slowly at stresses well below the yield strength, often without visible deformation or warning, and then the remaining section fractures suddenly. Many failures of shafts, axles, aircraft parts, welded structures and springs are fatigue failures, so fatigue design and inspection are critical.
What are beach marks on a fracture surface?
Beach marks are curved bands visible to the eye on many fatigue fracture surfaces. They form when crack growth stops and starts or the loading changes, leaving marks that point back to the crack origin. Microscopic striations, one per load cycle, can also be seen with an electron microscope.
Do aluminium alloys have an endurance limit?
No clear one. Steels and titanium alloys typically show a near horizontal S-N curve beyond about 10⁶ to 10⁷ cycles, called the endurance or fatigue limit. Aluminium and copper alloys keep losing strength with more cycles, so designers quote fatigue strength at a stated number of cycles, such as 5 × 10⁸.
References
- R. G. Budynas and J. K. Nisbett, Shigley's Mechanical Engineering Design, 11th ed., McGraw-Hill
- N. E. Dowling, Mechanical Behavior of Materials, 4th ed., Pearson
- J. A. Bannantine, J. J. Comer and J. L. Handrock, Fundamentals of Metal Fatigue Analysis, Prentice Hall
- ASTM E466, Standard Practice for Conducting Force Controlled Constant Amplitude Axial Fatigue Tests of Metallic Materials
- IIW, Recommendations for Fatigue Design of Welded Joints and Components, 2nd ed., Springer
Get one engineering email a week
New articles, worked examples and study notes every week. Free, no spam, unsubscribe any time.