Air Quality Index (AQI): Calculation and Pollutants
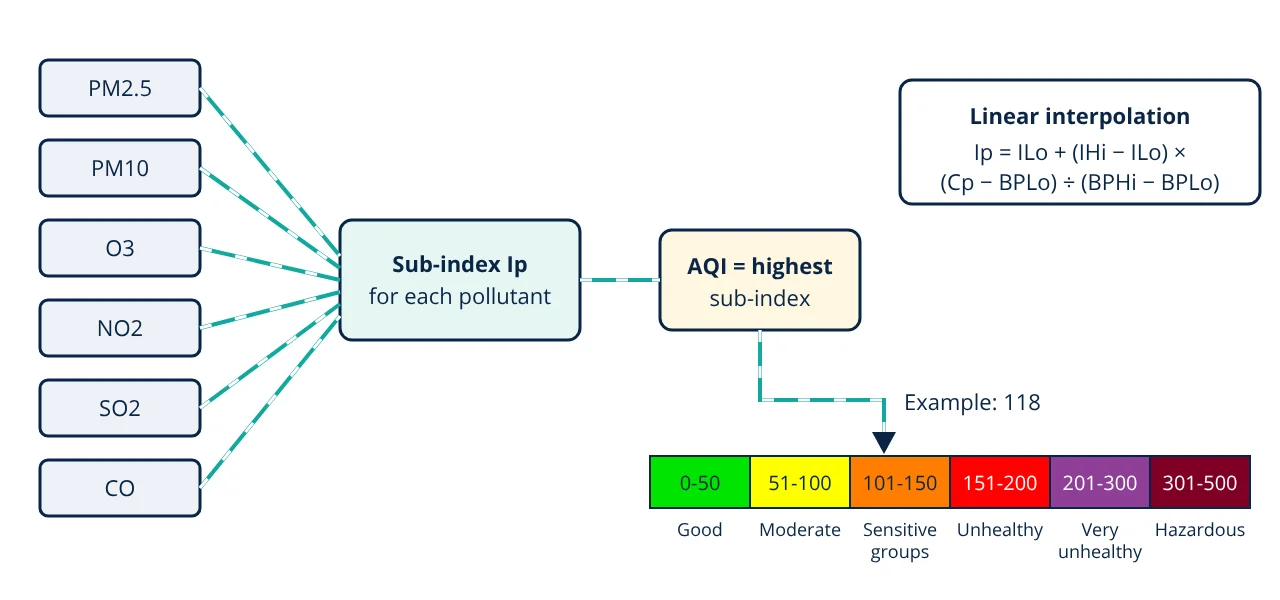
The air quality index (AQI) is a number from 0 to 500 that converts measured concentrations of the main air pollutants into one health-based value. Each pollutant gets a sub-index from breakpoint tables using linear interpolation, and the reported AQI is the highest sub-index, shown with a colour and category.
The air quality index is how most people meet air pollution data: a number on a weather app or a coloured board at a city junction. Behind it are continuous monitoring stations, averaging rules and breakpoint tables set by environmental agencies.
Pollutants in the air quality index
The US AQI covers the five pollutants regulated by the US national ambient air quality standards:
- Ground-level ozone (O3), usually as an 8-hour average.
- Particulate matter: PM2.5 (particles up to 2.5 µm) and PM10 (up to 10 µm), as 24-hour averages.
- Carbon monoxide (CO), 8-hour average.
- Sulfur dioxide (SO2), usually 1-hour average.
- Nitrogen dioxide (NO2), 1-hour average.
The Indian National Air Quality Index, launched by the Central Pollution Control Board in 2014, covers eight: PM10, PM2.5, NO2, SO2, CO, O3, ammonia (NH3) and lead (Pb). An Indian AQI is reported only when data for at least three pollutants are available, and one of them must be PM2.5 or PM10.
Averaging periods matter because health effects depend on exposure time. A one-hour spike of particulate matter does not mean the 24-hour average is high, so agencies use rules such as the EPA NowCast to give hourly particle readings that track the 24-hour index.
How the air quality index is calculated
For each pollutant, the agency publishes a breakpoint table: ranges of concentration that match ranges of index value. The sub-index is found by straight-line interpolation inside the range that contains the measured concentration:
where C_p is the truncated concentration of pollutant p, BP_Lo and BP_Hi are the breakpoints below and above it, and I_Lo and I_Hi are the index values at those breakpoints. The result is rounded to the nearest whole number.
The steps are:
- Average the raw monitor data over the required period for each pollutant.
- Truncate the concentration to the precision the table uses (for the US index, PM2.5 to one decimal place in µg/m³ and PM10 to a whole number).
- Find the breakpoint range and calculate the sub-index.
- Report the highest sub-index as the AQI and name that pollutant as the responsible pollutant.
Sub-indices are never added. A day with three pollutants at a sub-index of 90 still has an AQI of 90.
US EPA air quality index categories and breakpoints
The US index has six categories, each with a fixed colour. In May 2024 the EPA revised the PM2.5 breakpoints after it tightened the annual PM2.5 standard to 9.0 µg/m³.
| AQI | Category | Colour | PM2.5, 24 h (µg/m³) | PM10, 24 h (µg/m³) |
|---|---|---|---|---|
| 0 to 50 | Good | Green | 0.0 to 9.0 | 0 to 54 |
| 51 to 100 | Moderate | Yellow | 9.1 to 35.4 | 55 to 154 |
| 101 to 150 | Unhealthy for sensitive groups | Orange | 35.5 to 55.4 | 155 to 254 |
| 151 to 200 | Unhealthy | Red | 55.5 to 125.4 | 255 to 354 |
| 201 to 300 | Very unhealthy | Purple | 125.5 to 225.4 | 355 to 424 |
| 301 to 500 | Hazardous | Maroon | 225.5 to 325.4 | 425 to 604 |
An AQI of 100 generally matches the short-term national ambient standard for that pollutant, which is why values above 100 start to carry warnings for sensitive groups.
Indian National Air Quality Index
The CPCB index uses the same interpolation but its own categories and breakpoints.
| AQI | Category | PM2.5, 24 h (µg/m³) | PM10, 24 h (µg/m³) | NO2, 24 h (µg/m³) |
|---|---|---|---|---|
| 0 to 50 | Good | 0 to 30 | 0 to 50 | 0 to 40 |
| 51 to 100 | Satisfactory | 31 to 60 | 51 to 100 | 41 to 80 |
| 101 to 200 | Moderately polluted | 61 to 90 | 101 to 250 | 81 to 180 |
| 201 to 300 | Poor | 91 to 120 | 251 to 350 | 181 to 280 |
| 301 to 400 | Very poor | 121 to 250 | 351 to 430 | 281 to 400 |
| 401 to 500 | Severe | above 250 | above 430 | above 400 |
The Indian bands are tied to India’s own national ambient air quality standards; an index of 100 for PM2.5 matches its 24-hour standard of 60 µg/m³. The two indices therefore cannot be compared number for number, as the example shows.
- Given
- A monitoring station records 24-hour averages of PM2.5 = 42.3 µg/m³, PM10 = 120 µg/m³ and NO2 = 40 µg/m³.
- Find
- The US AQI using PM2.5 and PM10, and the Indian AQI using all three pollutants.
- Assumptions
- Averages are valid 24-hour values; for the Indian index, PM2.5 is truncated to a whole number (42); other pollutants are lower than these.
- Solution
- US PM2.5: range 35.5 to 55.4 maps to 101 to 150
Ip = (150 − 101) ÷ (55.4 − 35.5) × (42.3 − 35.5) + 101 = 2.462 × 6.8 + 101 = 117.7, so 118
US PM10: range 55 to 154 maps to 51 to 100
Ip = (100 − 51) ÷ (154 − 55) × (120 − 55) + 51 = 0.495 × 65 + 51 = 83.2, so 83
US AQI = highest = 118
India PM2.5: range 31 to 60 maps to 51 to 100
Ip = (49 ÷ 29) × (42 − 31) + 51 = 69.6, so 70
India PM10: range 101 to 250 maps to 101 to 200
Ip = (99 ÷ 149) × (120 − 101) + 101 = 113.6, so 114
India NO2: 40 is the top of 0 to 40, so Ip = 50
Indian AQI = highest = 114 - Answer
- US AQI 118, Unhealthy for sensitive groups, set by PM2.5. Indian AQI 114, Moderately polluted, set by PM10.
- Limitations
- Real reporting applies data completeness rules and, for hourly displays, averaging such as the NowCast; check the current agency tables before use.
Key formulas for the air quality index
| Quantity | Formula | Symbols and units |
|---|---|---|
| Pollutant sub-index | Ip = (IHi − ILo) ÷ (BPHi − BPLo) × (Cp − BPLo) + ILo | Cp = truncated concentration; BP = breakpoints in the same units; I = index values at the breakpoints |
| Reported AQI | AQI = max(Ip) | Highest sub-index of all pollutants measured |
| Slope within a band | (IHi − ILo) ÷ (BPHi − BPLo) | Index points per unit of concentration |
Limits of the air quality index
The AQI is a communication tool, not a full exposure assessment. It reports one pollutant at a time and ignores combined effects. It describes outdoor air near the monitor, which may differ from indoor air or a busy roadside. The 2021 WHO air quality guidelines are stricter than most national standards, so a Good or Satisfactory index does not mean pollution is at the WHO guideline level.
For engineers, the AQI sits at the end of a chain that starts at emission sources. Stack monitoring is covered in continuous emission monitoring systems, particle control in the electrostatic precipitator and wet scrubber articles, and baseline air quality studies in environmental impact assessment.
Air quality index interview and viva questions
- What does the air quality index represent? It converts concentrations of several pollutants into one number on a 0 to 500 scale linked to health effects, with a category and colour for the public.
- How is a pollutant sub-index calculated? By linear interpolation between the two breakpoints that bracket the measured concentration, using the index values assigned to those breakpoints.
- How is the overall AQI found from the sub-indices? The highest sub-index is reported as the AQI, and that pollutant is named as the responsible pollutant; sub-indices are not added.
- What minimum data does the Indian National AQI need? Data for at least three pollutants, one of which must be PM2.5 or PM10.
- Why can the same air give different AQI values in the US and India? The two systems use different breakpoint tables and category bands, so the same concentration maps to a different index value.
Frequently asked questions
Why is the AQI set by only one pollutant?
Each pollutant is converted to its own sub-index on the same 0 to 500 scale, and the reported AQI is the highest of them. The pollutant with the highest sub-index is called the responsible or prominent pollutant, because it sets the health message. Sub-indices are not added together.
Is the AQI the same in every country?
No. The method is similar, but breakpoints, category names and pollutant averaging rules differ. The same PM2.5 concentration can give a different AQI value and category in the US index and the Indian National AQI, so values from different systems should not be compared directly.
What AQI value is considered safe?
In the US index, 0 to 50 is Good and 51 to 100 is Moderate; above 100, sensitive groups such as children, older adults and people with heart or lung disease may be affected. In the Indian index, 0 to 50 is Good and 51 to 100 is Satisfactory. An AQI of 100 in the US system generally corresponds to the short-term national ambient standard.
References
- US EPA, Technical Assistance Document for the Reporting of Daily Air Quality: the Air Quality Index (AQI), EPA-454/B-24-002, May 2024
- Central Pollution Control Board (CPCB), National Air Quality Index, Control of Urban Pollution Series CUPS/82/2014-15, New Delhi, 2014
- WHO global air quality guidelines: particulate matter (PM2.5 and PM10), ozone, nitrogen dioxide, sulfur dioxide and carbon monoxide, World Health Organization, 2021
- US EPA, 40 CFR Part 58, Appendix G: Uniform Air Quality Index (AQI) and Daily Reporting
- M. L. Davis and D. A. Cornwell, Introduction to Environmental Engineering, 5th ed., McGraw-Hill
Get one engineering email a week
New articles, worked examples and study notes every week. Free, no spam, unsubscribe any time.