The Data Science Workflow from Data to Decision
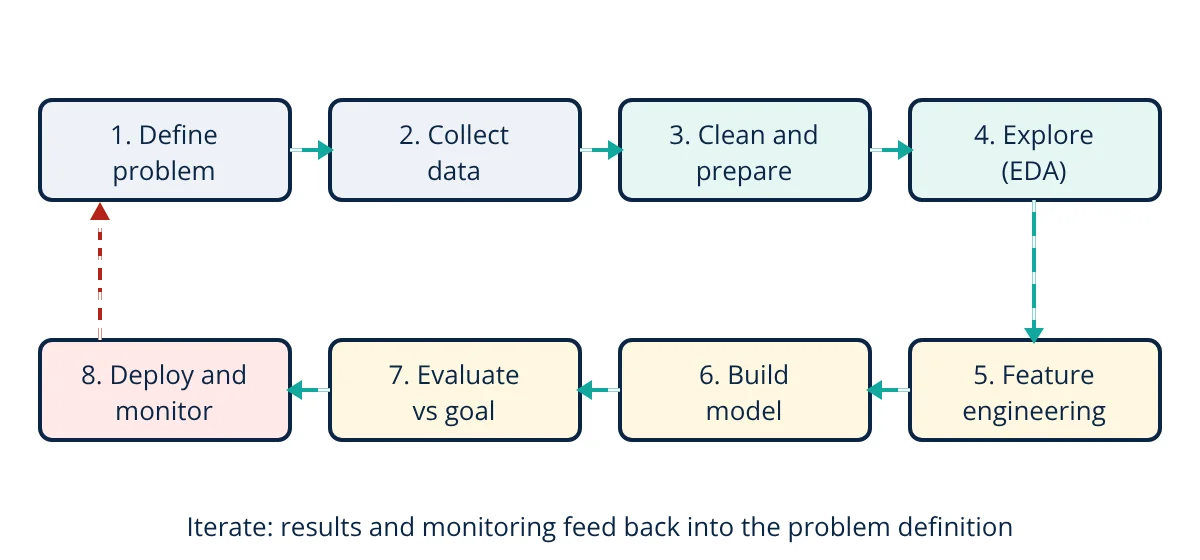
The data science workflow turns raw data into decisions in repeatable steps: define the problem, collect data, clean and prepare it, explore it to understand patterns, engineer features, build models, evaluate them against the business goal, then deploy and monitor the result. The process is iterative: findings at any stage often send you back to an earlier one. Frameworks such as CRISP-DM formalise these phases.
Data science combines statistics, programming and domain knowledge to answer questions with data. Projects fail far more often from a poorly defined question or bad data than from the wrong algorithm. A clear workflow keeps the work focused on the decision it is meant to support.
1. Define the problem
Start with the decision, not the data. What will someone do differently because of the result? Turn a vague goal (“use our sensor data”) into a measurable question (“predict which compressors will need unplanned repair in the next 30 days, so maintenance can be scheduled”).
It also helps to ask whether data science is needed at all. Some questions are answered by a simple query, a better report or an engineering calculation. Others need a model because the pattern is too complex or the data too large to inspect by hand.
Agree on success criteria early: the metric, the target value, the cost of false alarms versus missed events, and who will use the output.
2. Collect data
Identify the sources: databases, historians, ERP and maintenance systems, spreadsheets, APIs, sensors or surveys. Data usually arrives through data pipelines built by data engineers. Check:
- Is there enough history and enough examples of the events of interest?
- Is the data representative of the conditions where the model will be used?
- Are there legal, privacy or access restrictions?
3. Clean and prepare
Real data is messy. Typical work:
- Missing values: remove, fill with a sensible value, or flag them.
- Outliers: investigate before removing; some are sensor faults, others are the events you care about.
- Units and scaling: convert to consistent units and handle mixed formats.
- Duplicates and inconsistent labels: “Pump-01”, “PUMP 1” and “P01” may be the same asset.
- Time alignment: match time zones and sampling rates when joining sources.
This step often takes more than half of the project time, and it has the biggest effect on the result.
4. Exploratory data analysis
Exploratory data analysis (EDA) builds understanding before modelling. Calculate summary statistics such as mean, median and standard deviation, plot distributions, look at trends over time, and check correlations between variables. EDA often reveals data problems and sometimes answers the question without any model.
A common screening tool is the z-score, which measures how many standard deviations a value is from the mean:
5. Feature engineering
Features are the inputs a model learns from. Good features carry domain knowledge: rolling averages, rates of change, time since last service, ratios such as power per unit flow, and day of week or shift. Categorical values are encoded as numbers, and numeric features may be scaled. Well chosen features often improve results more than a more complex algorithm.
6. Build models
Choose the approach to fit the question: supervised learning for predicting a known target, unsupervised learning for finding groups or anomalies. Begin with a simple baseline, such as always predicting the average or a linear model, then try stronger methods like gradient boosted trees or neural networks. Split data into training, validation and test sets, and for time series always test on later data than you train on.
7. Evaluate against the goal
Technical metrics (accuracy, precision, recall, mean absolute error) must be translated into business value. A model with 95% accuracy can be useless if the event of interest is only 2% of cases.
- Given
- A compressor failure model is tested on 1000 machine months. There were 20 real failures. The model raised 50 alerts, of which 15 were real failures.
- Find
- Precision, recall and accuracy.
- Assumptions
- Each machine month is one prediction; an alert counts as a prediction of failure.
- Solution
- True positives TP = 15; false positives FP = 50 − 15 = 35; false negatives FN = 20 − 15 = 5
True negatives TN = 1000 − 15 − 35 − 5 = 945
Precision = TP ÷ (TP + FP) = 15 ÷ 50 = 0.30
Recall = TP ÷ (TP + FN) = 15 ÷ 20 = 0.75
Accuracy = (TP + TN) ÷ 1000 = 960 ÷ 1000 = 0.96 - Answer
- Precision 30%, recall 75%, accuracy 96%: the model catches most failures but 7 of 10 alerts are false alarms
- Limitations
- Whether this is good enough depends on the cost of an inspection compared with an unplanned failure, which is a business decision.
8. Deploy and monitor
A model only creates value when it is used. Deployment can mean a dashboard, a scheduled report, an alert in a maintenance system or a real time API. After deployment:
- Monitor performance, because data drifts as processes, equipment and behaviour change.
- Retrain on new data at a planned interval or when performance drops.
- Document the data, assumptions and limitations so others can trust and maintain the model.
- Collect feedback from users to refine the problem definition, closing the loop.
Tools for the data science workflow
- Languages: Python (pandas, scikit-learn, matplotlib) and R are the most common; SQL is essential for data access.
- Notebooks such as Jupyter for exploration; scripts and version control (Git) for anything that will be reused.
- Reproducibility: fix random seeds, record data versions and keep code in a repository.
- Collaborate: review analysis and code with colleagues, and involve domain experts at every stage, not only at the end.
- Communicate: a clear chart and a one paragraph conclusion usually matter more than the model details.
The data science workflow is not a straight line but a cycle. Teams that keep the decision in view, invest in clean data and monitor results after deployment get far more value than those that focus only on algorithms. For large data volumes, see the five Vs of big data.
Frequently asked questions
Which step of the data science workflow takes the most time?
Data collection and cleaning usually take the largest share, often more than half of the project time. Real data has missing values, wrong units, duplicates, inconsistent names and time zone problems, and fixing these carefully matters more to the result than the choice of algorithm.
What is CRISP-DM?
CRISP-DM, the Cross-Industry Standard Process for Data Mining, is a widely used framework that divides a project into six phases: business understanding, data understanding, data preparation, modelling, evaluation and deployment. It stresses that the phases are iterative, with frequent loops back to earlier steps.
What is the difference between a data scientist and a data engineer?
A data engineer builds and maintains the pipelines, storage and platforms that collect and deliver reliable data. A data scientist uses that data to analyse problems, build models and communicate insights. In small teams one person often does both.
References
- P. Chapman et al., CRISP-DM 1.0 Step-by-step data mining guide, SPSS, 2000
- H. Wickham, M. Çetinkaya-Rundel and G. Grolemund, R for Data Science, 2nd ed., O'Reilly, 2023
- W. McKinney, Python for Data Analysis, 3rd ed., O'Reilly, 2022
- F. Provost and T. Fawcett, Data Science for Business, O'Reilly, 2013
Get one engineering email a week
New articles, worked examples and study notes every week. Free, no spam, unsubscribe any time.