Rock Mass Classification: RMR and Q-System
Rock mass classification systems give a numerical rating of rock quality for designing excavations and support. RQD (Rock Quality Designation) measures core intactness. Bieniawski’s RMR (Rock Mass Rating) adds ratings for intact strength, RQD, joint spacing, joint condition and groundwater, then adjusts for joint orientation, giving a score from 0 to 100 in five classes from very poor to very good rock. Barton’s Q-system combines six parameters as Q = (RQD/Jn)(Jr/Ja)(Jw/SRF) on a logarithmic scale from 0.001 to 1000, and links Q with excavation span to recommend bolts and shotcrete. GSI feeds rock mass strength criteria.
Rock in mines and tunnels is cut by joints, faults and bedding planes, and it may be weathered or wet. Laboratory tests on small samples cannot capture this. Rock mass classification gives engineers a practical, repeatable way to describe rock quality from core logging and mapping, compare sites, estimate rock mass properties and choose support, especially at early design stages.
Rock Quality Designation (RQD)
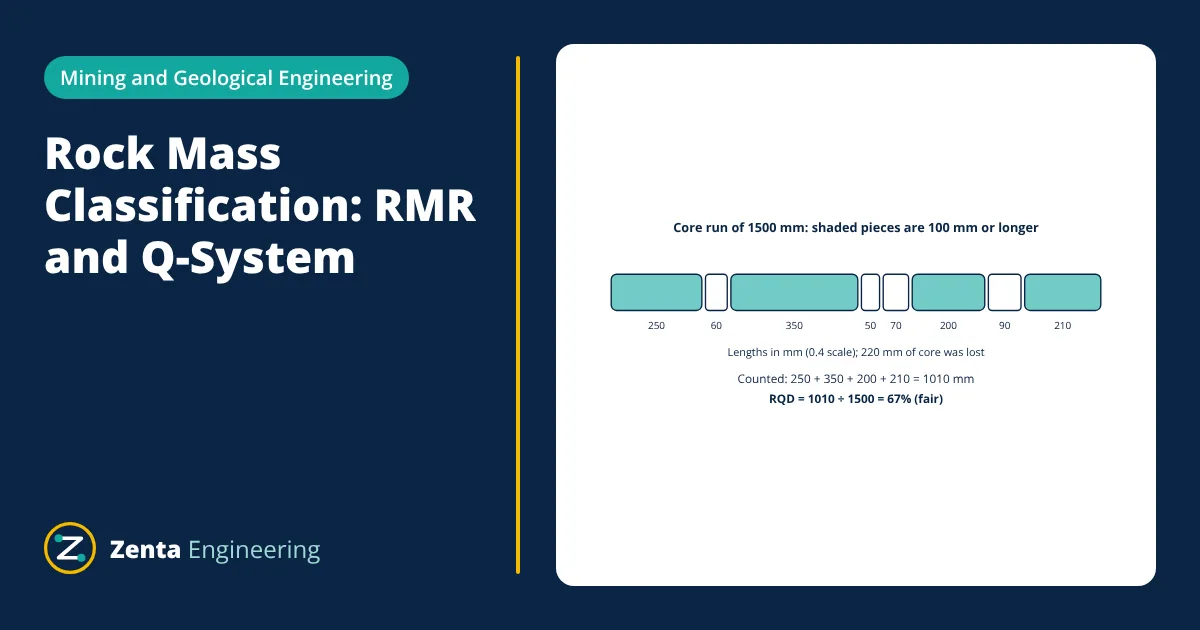
Developed by Deere in the 1960s, RQD is the percentage of a drill core run made up of intact pieces 100 mm or longer:
| RQD (%) | Rock quality |
|---|---|
| 0 to 25 | Very poor |
| 25 to 50 | Poor |
| 50 to 75 | Fair |
| 75 to 90 | Good |
| 90 to 100 | Excellent |
RQD is simple but ignores joint condition, orientation and water, so it is used as an input to fuller systems.
Bieniawski’s Rock Mass Rating (RMR)
The RMR system (1973, updated 1989) sums ratings for five parameters, then applies an adjustment for joint orientation relative to the excavation:
| Parameter | Rating range |
|---|---|
| 1. Uniaxial compressive strength of intact rock | 0 to 15 |
| 2. RQD | 3 to 20 |
| 3. Spacing of discontinuities | 5 to 20 |
| 4. Condition of discontinuities (roughness, aperture, infill, weathering, persistence) | 0 to 30 |
| 5. Groundwater conditions | 0 to 15 |
| Adjustment for joint orientation (tunnels) | 0 to −12 |
RMR classes:
| RMR | Class | Description | Typical stand-up time (example span) |
|---|---|---|---|
| 81 to 100 | I | Very good rock | 20 years for 15 m span |
| 61 to 80 | II | Good rock | 1 year for 10 m span |
| 41 to 60 | III | Fair rock | 1 week for 5 m span |
| 21 to 40 | IV | Poor rock | 10 hours for 2.5 m span |
| 0 to 20 | V | Very poor rock | 30 minutes for 1 m span |
RMR also gives estimates of rock mass cohesion and friction angle, and through correlations, the rock mass deformation modulus.
Barton’s Q-system
Developed at the Norwegian Geotechnical Institute in 1974 from many tunnel case histories, the Q-system rates rock quality as:
- RQD/Jn: block size, where Jn is the joint set number.
- Jr/Ja: inter-block shear strength, from joint roughness Jr and joint alteration Ja.
- Jw/SRF: active stress, from joint water reduction Jw and stress reduction factor SRF, which covers weakness zones, high stress and squeezing or swelling rock.
Q ranges from about 0.001 (exceptionally poor) to 1000 (exceptionally good). The Q support chart plots Q against the equivalent dimension, span divided by an excavation support ratio (ESR) that reflects how critical the opening is, and recommends bolt spacing and length and shotcrete thickness.
A widely used correlation between the two systems is RMR ≈ 9 ln Q + 44.
Geological Strength Index (GSI)
Introduced by Hoek, GSI rates rock mass from 0 to 100 using a chart of structure (blockiness) against surface condition of joints. It is the main input to the Hoek-Brown failure criterion for estimating rock mass strength and modulus in numerical models.
- Given
- A granite drive: intact strength 150 MPa (rating 12), RQD 67% (rating 13), joint spacing 0.4 m (rating 10), joints slightly rough, separation below 1 mm, slightly weathered walls (rating 25), damp conditions (rating 10). Joint orientation is fair for the tunnel direction (adjustment −5).
- Find
- The RMR, rock class and approximate Q value.
- Assumptions
- Ratings taken from the 1989 RMR tables; correlation RMR = 9 ln Q + 44.
- Solution
- Basic RMR = 12 + 13 + 10 + 25 + 10 = 70
Adjusted RMR = 70 − 5 = 65 (Class II, good rock)
ln Q = (65 − 44) ÷ 9 = 2.33; Q ≈ e^2.33 ≈ 10 - Answer
- RMR = 65, Class II good rock, with Q around 10; typically needing systematic or spot bolting with local mesh or thin shotcrete for normal mine drive spans
- Limitations
- Correlations between systems have wide scatter; support must be confirmed by observation, monitoring and local experience.
Using rock mass classification in design
- Preliminary support design for tunnels, drives, shafts and caverns.
- Stope design with modified systems such as Laubscher’s MRMR for caving and the stability graph method for open stopes.
- Slope design with Romana’s slope mass rating (SMR), relevant to open pits.
- Estimating rock mass properties for numerical modelling.
- Choosing mining methods, since strong rock allows large open stopes while weak rock needs fill or caving, as discussed in surface vs underground mining.
Collecting the data
Classification inputs come from several sources. Core logging records RQD, fracture frequency, joint roughness and infill along every drill hole. Face mapping during excavation records joint sets, spacing, persistence and water. Laboratory tests give intact strength, and point load tests offer a quick field estimate. Consistent logging standards and photos of every core box make ratings repeatable between geologists and over time.
Limitations and good practice
Classification is a starting point for design, not a substitute for engineering analysis. Ratings should always be recorded with the data behind them so that others can review and update them as excavation reveals more of the ground. For critical or unusual excavations, numerical modelling and site specific testing are essential.
Classification systems simplify complex ground. They may not capture stress driven failures in deep mines, time dependent squeezing, or individual wedges defined by specific joints. Good practice is to use more than one system, map rock carefully during excavation, monitor displacements with extensometers and convergence measurements, and update designs. Rock quality also influences drilling and blasting design and the stability of foundations, much as soil properties control bearing capacity in civil works.
Frequently asked questions
What is the difference between intact rock and rock mass?
Intact rock is a piece of rock without significant discontinuities, tested in the lab for strength. A rock mass is the rock in place, including joints, faults, bedding and weathering. The discontinuities usually control the behaviour of the rock mass, which is why rock mass strength is much lower than intact rock strength.
Should I use RMR or the Q-system?
Both are widely used and engineers often apply both and cross check them. RMR is simple and common in mining and slope work. The Q-system has a large database of tunnel cases and a well defined support chart, so it is popular for tunnels and underground excavations. Neither replaces judgement and observation.
How is RQD measured?
Rock Quality Designation is measured on drill core: add up the lengths of intact core pieces 100 mm or longer within a core run and divide by the total run length, expressed as a percentage. Breaks caused by drilling or handling are ignored.
References
- Z. T. Bieniawski, Engineering Rock Mass Classifications, Wiley, 1989
- N. Barton, R. Lien and J. Lunde, Engineering classification of rock masses for the design of tunnel support, Rock Mechanics, 6, 189-236, 1974
- D. U. Deere, Technical description of rock cores for engineering purposes, Rock Mechanics and Engineering Geology, 1964
- E. Hoek, Practical Rock Engineering, RocScience, 2007
- NGI, Using the Q-system: Rock mass classification and support design, Norwegian Geotechnical Institute, 2015
Get one engineering email a week
New articles, worked examples and study notes every week. Free, no spam, unsubscribe any time.