PFD vs P&ID: Differences and How to Read Them

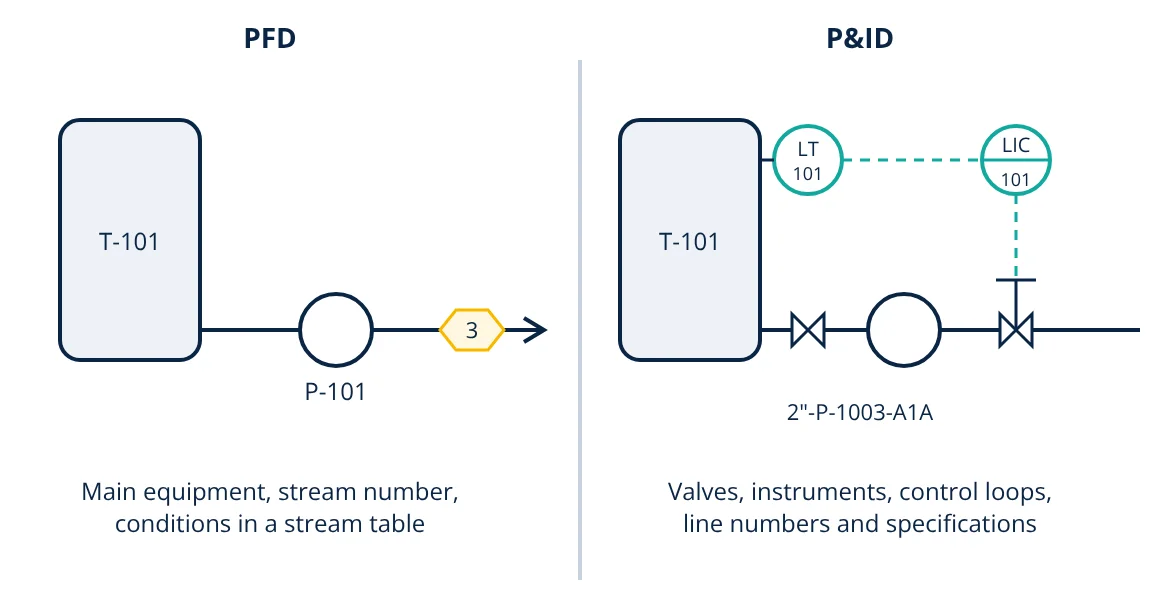
In the PFD vs P&ID comparison, a process flow diagram (PFD) shows the main equipment, main process streams and operating conditions, together with a heat and material balance table: what the process does. A piping and instrumentation diagram (P&ID) shows every pipe, valve, instrument, control loop and safety device with tags and specifications: how the plant is built and controlled. The PFD comes first in design; the P&ID is the master document for construction, operation and maintenance.
Engineers communicate a process plant through drawings. Two of the most important are the PFD and the P&ID. They look similar at first glance, since both are schematic and not to scale, but they serve different purposes and audiences. Knowing what belongs on each, and how to read them, is an essential skill for process, instrumentation, mechanical and operations engineers.
What is a PFD?
A process flow diagram is produced during process design to describe the process concept. It typically shows:
- Major equipment: vessels, columns, reactors, heat exchangers, pumps and compressors, with tag numbers and key design data.
- Main process streams with stream numbers, flow direction and connections.
- A stream table of flow rates, compositions, temperatures and pressures, taken from the material balance and energy balance.
- Major control loops at a conceptual level.
- Utilities only where they matter to the process (steam to a reboiler, cooling water to a condenser).
It does not show minor lines, isolation valves, drains, vents, instrument details or piping specifications.
What is a P&ID?
A piping and instrumentation diagram develops the PFD into a complete schematic of the plant for detailed engineering. It shows:
- All equipment, including spares and packages, with tags.
- All piping, with line numbers giving size, fluid service, sequence number, piping class and insulation.
- All valves: isolation, control, check, relief and manual valves, with their types.
- All instruments and control loops, with ISA style tag bubbles indicating function and location (field, control room panel, DCS, safety system).
- Safety devices, interlocks and shutdown systems.
- Vents, drains, sample points, reducers, strainers, spectacle blinds and tie-ins.
- Off-page connectors to link sheets.
PFD vs P&ID: key differences
| Feature | PFD | P&ID |
|---|---|---|
| Purpose | Show process concept and balances | Show complete piping, instruments and controls |
| Stage | Conceptual and basic design | Detailed design, construction, operation |
| Equipment | Major items only | All items, including spares and packages |
| Lines | Main process streams | Every line with line number and specification |
| Valves | Usually only control valves of interest | All valves, with types |
| Instruments | Key loops, conceptual | Every instrument and loop, fully tagged |
| Process data | Stream table with flows and conditions | Design data in equipment and line lists |
| Main users | Process engineers, management | All disciplines, operators, maintenance, safety reviews (HAZOP) |
How to read a P&ID
- Start with the legend sheets. They define symbols, line types, abbreviations and the tag format used in that project. Standard symbol sets are summarised in P&ID symbols on InstrumentationBlog.in.
- Find the main process path. Follow the heavy lines from feed to product, equipment by equipment, as on the PFD.
- Read equipment tags. A letter prefix shows type (for example V for vessel, P for pump, E for exchanger, T for tank or tower, depending on the project) and a number shows its unit and sequence.
- Read line numbers. These typically encode size, service, sequence and piping class, for example 2”-P-1003-A1A.
- Read instrument bubbles. The letters give the function; the number is the loop. A circle alone means a field instrument; a line through it means control room panel; a circle in a square indicates a shared display such as a DCS.
- Trace control loops. Follow the dashed signal lines from transmitter to controller to final element, usually a control valve.
- Check safety features. Relief valves, shutdown valves, interlocks and alarms are often shown with special symbols and tags.
Instrument identification letters (ISA 5.1)
The first letter is the measured or initiating variable; succeeding letters describe functions:
| First letter | Variable | Succeeding letter | Function |
|---|---|---|---|
| F | Flow | I | Indicate |
| L | Level | T | Transmit |
| P | Pressure | C | Control |
| T | Temperature | V | Valve |
| A | Analysis | A | Alarm (with H or L for high or low) |
| S | Speed | E | Primary element (sensor) |
- Given
- A P&ID shows bubbles tagged LT-101, LIC-101 and LV-101 around a tank, and PSV-102 on top of it.
- Find
- What each tag means and how the loop works.
- Assumptions
- Tags follow ANSI/ISA 5.1 conventions; 101 and 102 are loop numbers.
- Solution
- LT-101: level transmitter in loop 101
LIC-101: level indicating controller in the same loop
LV-101: level control valve, the final element
PSV-102: pressure safety valve, a separate safety device - Answer
- The transmitter measures tank level, the controller compares it with the set point and positions the control valve on the outlet; the safety valve independently protects the tank from overpressure
- Limitations
- Projects may add their own letter conventions; always check the legend sheet.
Decoding tags quickly gets easier with practice, and an instrument tag decoder helps with less common combinations.
Who uses which drawing
- PFDs are used for process design, debottlenecking studies, operator training overviews and cost estimates.
- P&IDs are used by piping, instrumentation, electrical and mechanical engineers in detailed design; by operators and maintenance teams for isolation and permits; and in hazard and operability (HAZOP) studies, where each line and control loop is reviewed node by node.
Both drawings must be kept up to date, and a revision block on each sheet records every change. Every modification in the field should be marked up and incorporated into the as-built P&ID, because operators rely on it to isolate equipment safely. Equipment on both drawings, from pressure vessels to distillation columns and heat exchangers, is described further in their own articles.
Frequently asked questions
Which comes first, the PFD or the P&ID?
The PFD comes first. It is produced during process design from the heat and material balance. The P&ID is developed from it during detailed engineering, adding every line, valve, instrument and control loop needed to build and operate the plant.
What standard is used for P&ID symbols and instrument tags?
ANSI/ISA 5.1, Instrumentation Symbols and Identification, is the most widely used standard for instrument bubbles, identification letters and loop numbering. ISO 10628 covers diagrams for the chemical and petrochemical industry and ISO 14617 graphical symbols. Many companies also add their own legend sheets.
Does a P&ID show pipe lengths and equipment locations?
No. A P&ID is not to scale and does not show physical layout. Pipe routing, lengths, elevations and equipment positions are shown on plot plans, piping layouts and isometric drawings.
References
- ANSI/ISA-5.1-2009 Instrumentation Symbols and Identification, International Society of Automation
- ISO 10628-1:2014 Diagrams for the chemical and petrochemical industry, Part 1: Specification of diagrams
- R. K. Sinnott and G. Towler, Chemical Engineering Design, 6th ed., Butterworth-Heinemann
- M. Toghraei, Piping and Instrumentation Diagram Development, Wiley
Get one engineering email a week
New articles, worked examples and study notes every week. Free, no spam, unsubscribe any time.